Research-led, metrics-forward, and continuously improving. News from the Office of Research Outputs.
12 October 2026
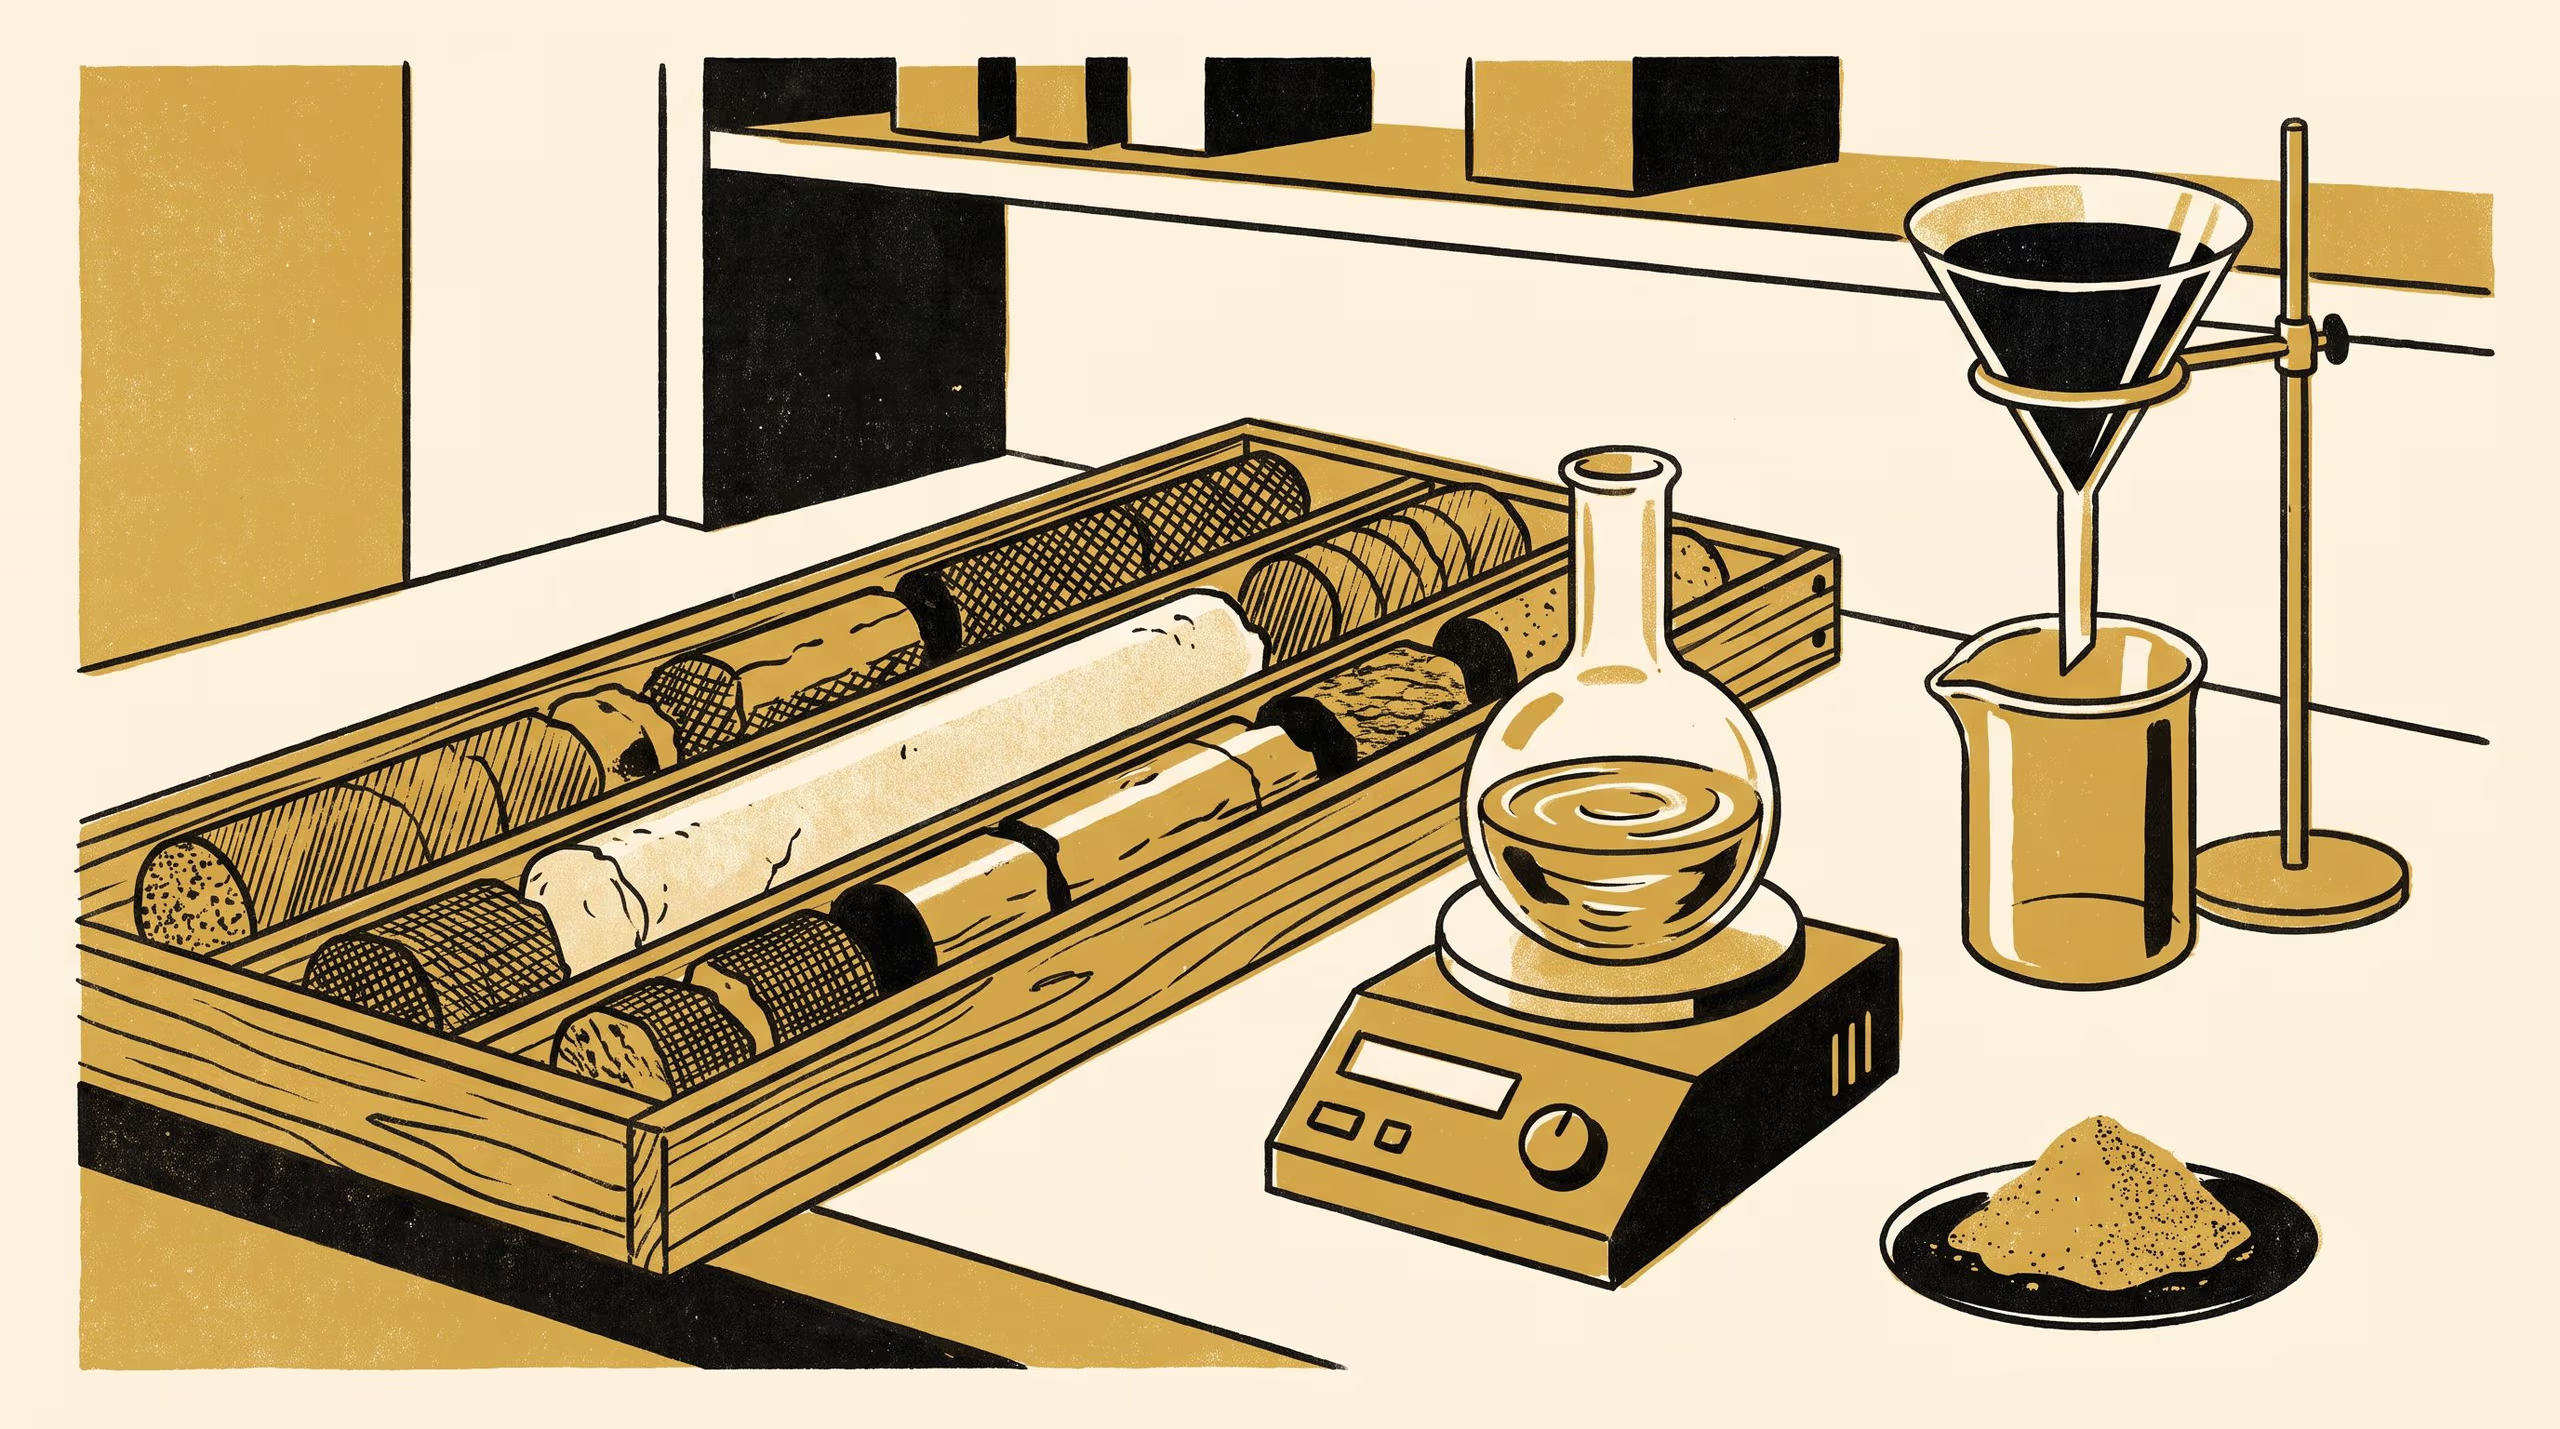
A School of Underlying Conditions paper activates a bentonite seam known from one drill-hole intersection and measures how well it removes pigment from cold-pressed rapeseed oil.
The School of Emergent Priorities has released a display advertisement inviting the public to the University's research on what a street canopy costs to keep.
A Slop University research poster reconstructs the ancestry of 41 copied analysis scripts in one pharmacology laboratory and reports which of them still return the same answer.
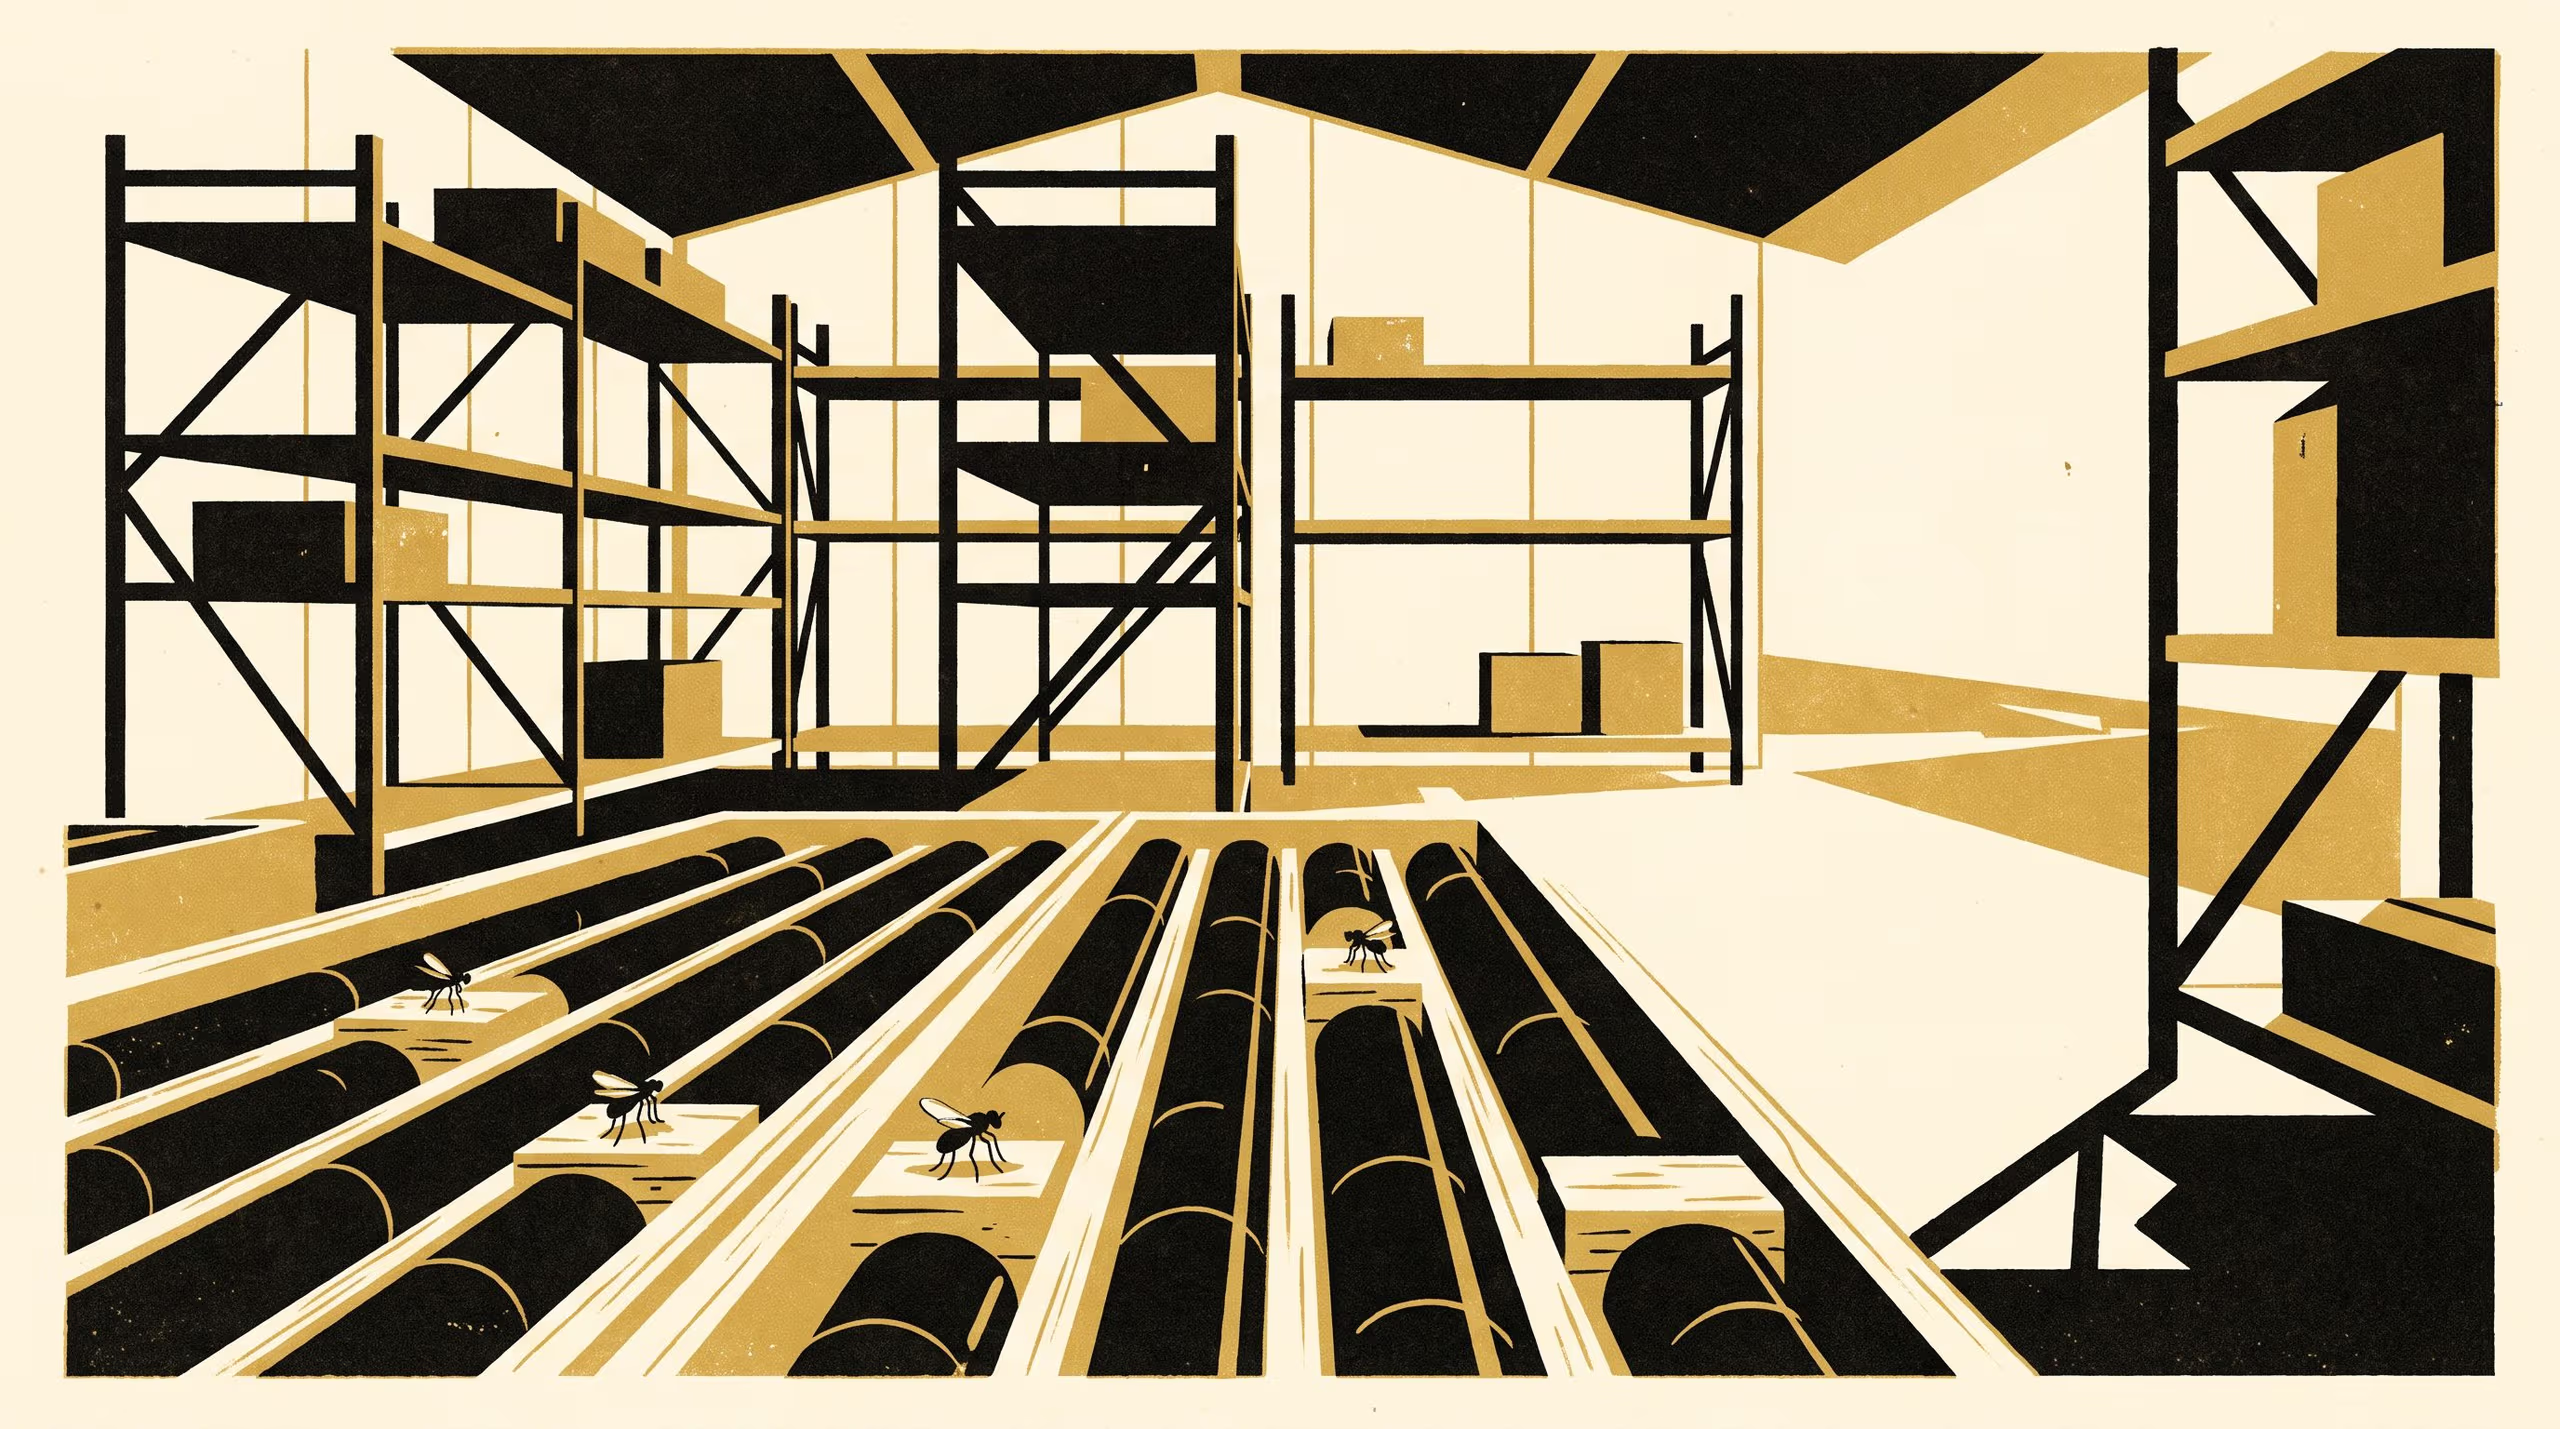
A paper from the School of Underlying Conditions reports the territorial behaviour of a small long-legged fly living among stored drill core.
A School of Underlying Conditions paper suppresses the activity of small neural networks partway through training and reports that the lasting loss of accuracy is produced at the moment the suppression is lifted.
A Slop University paper applies the fatigue engineer's stress-life curve to an optical chip, counting how many times it can form a soliton before it no longer does.
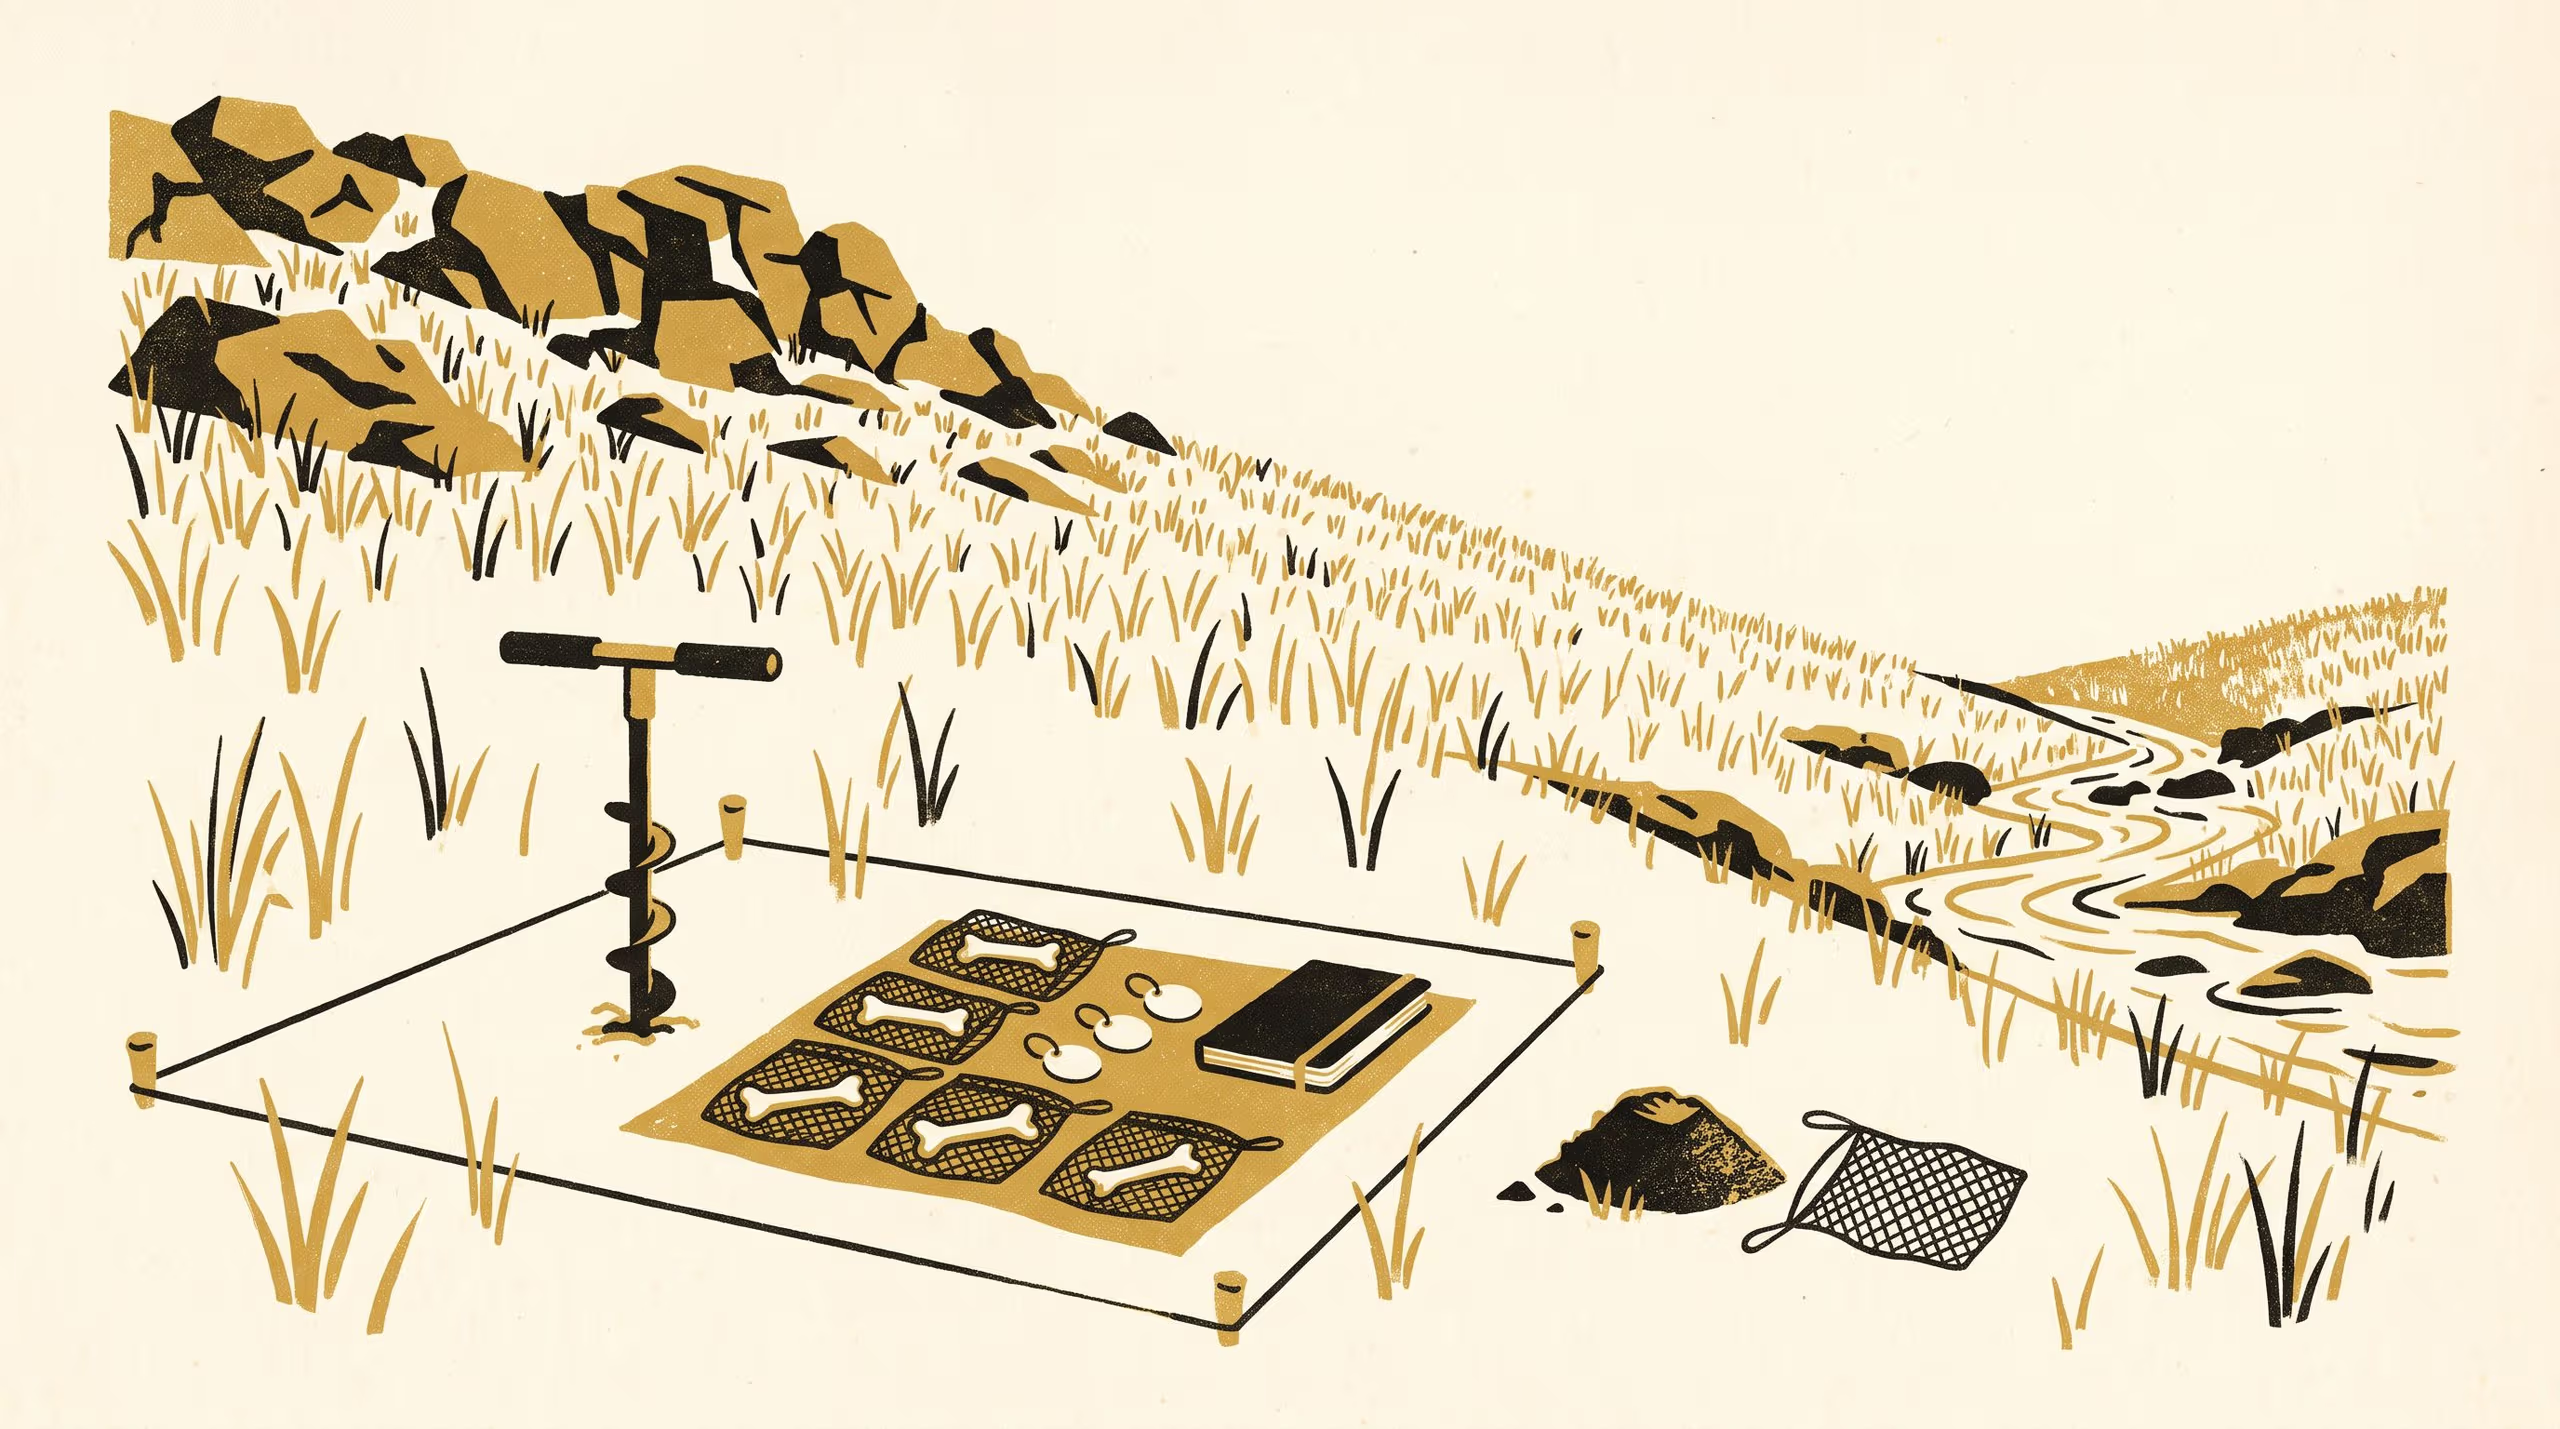
A School of Underlying Conditions paper borrows the ecologist's litterbag to follow the collagen in buried sheep bone down one hillslope for eighteen months.
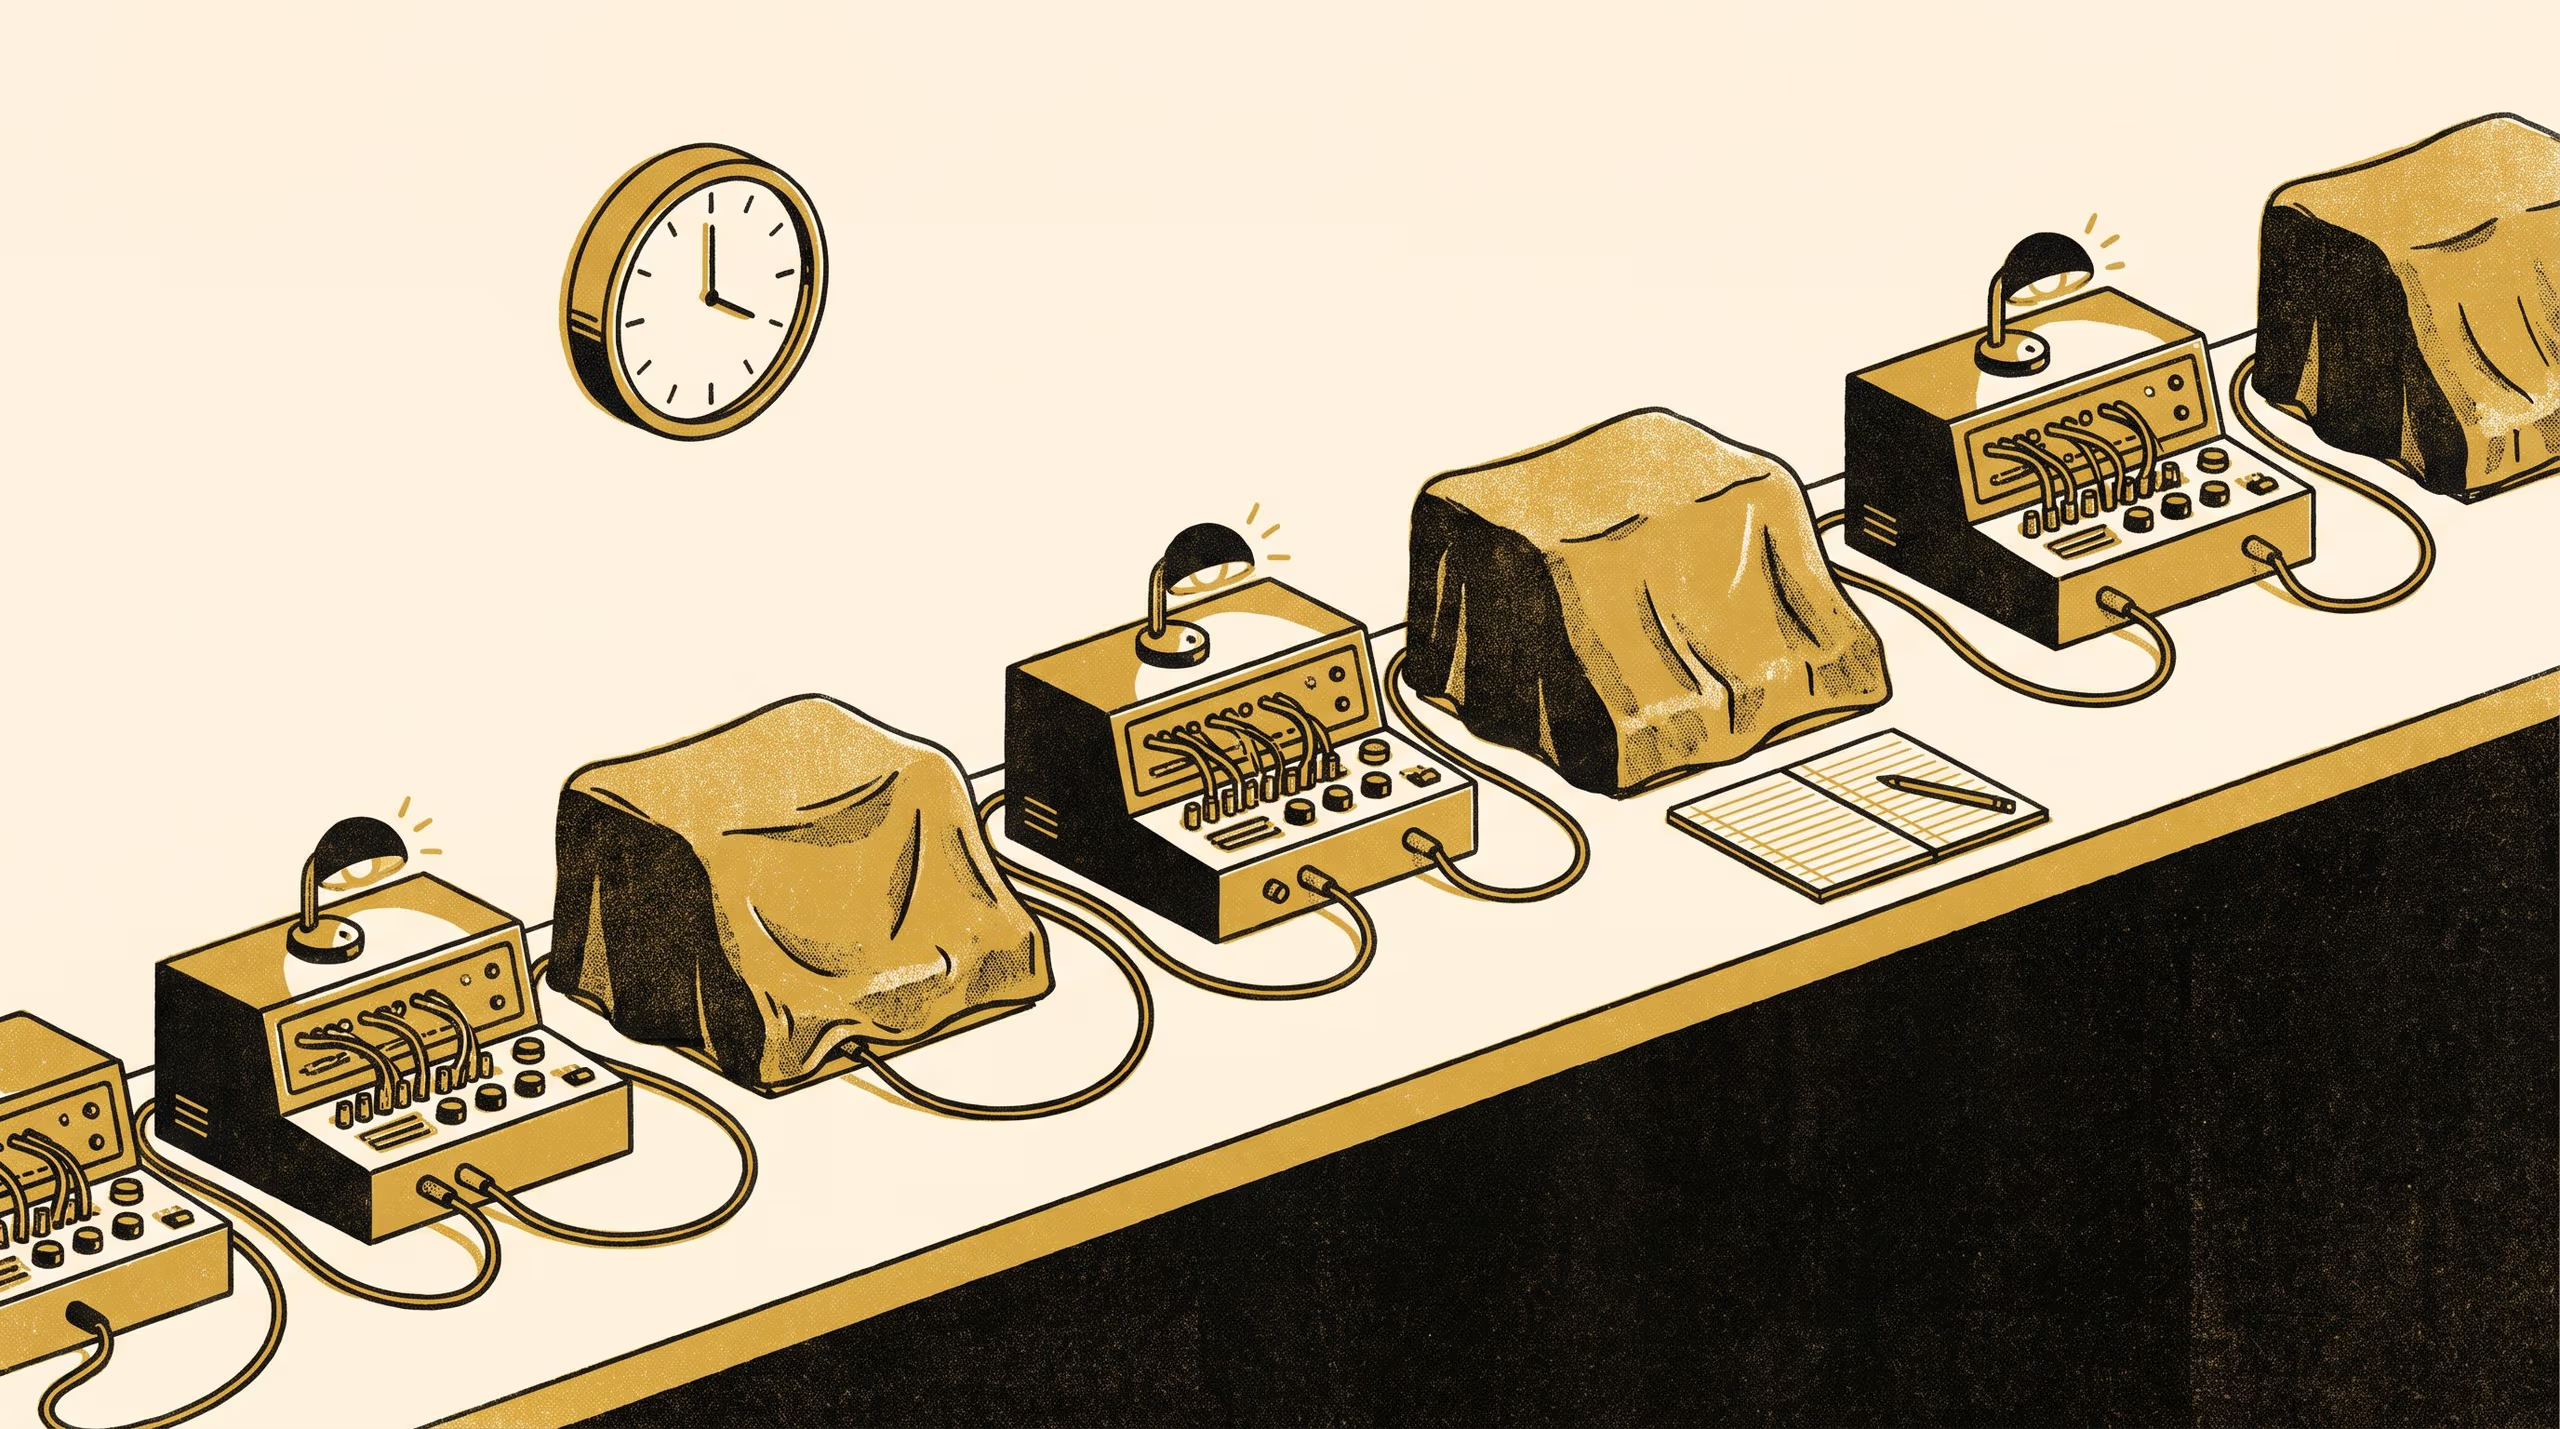
A School of Underlying Conditions poster traces the early fading of a stored hologram to the one light in a basement optics room that is never switched off.
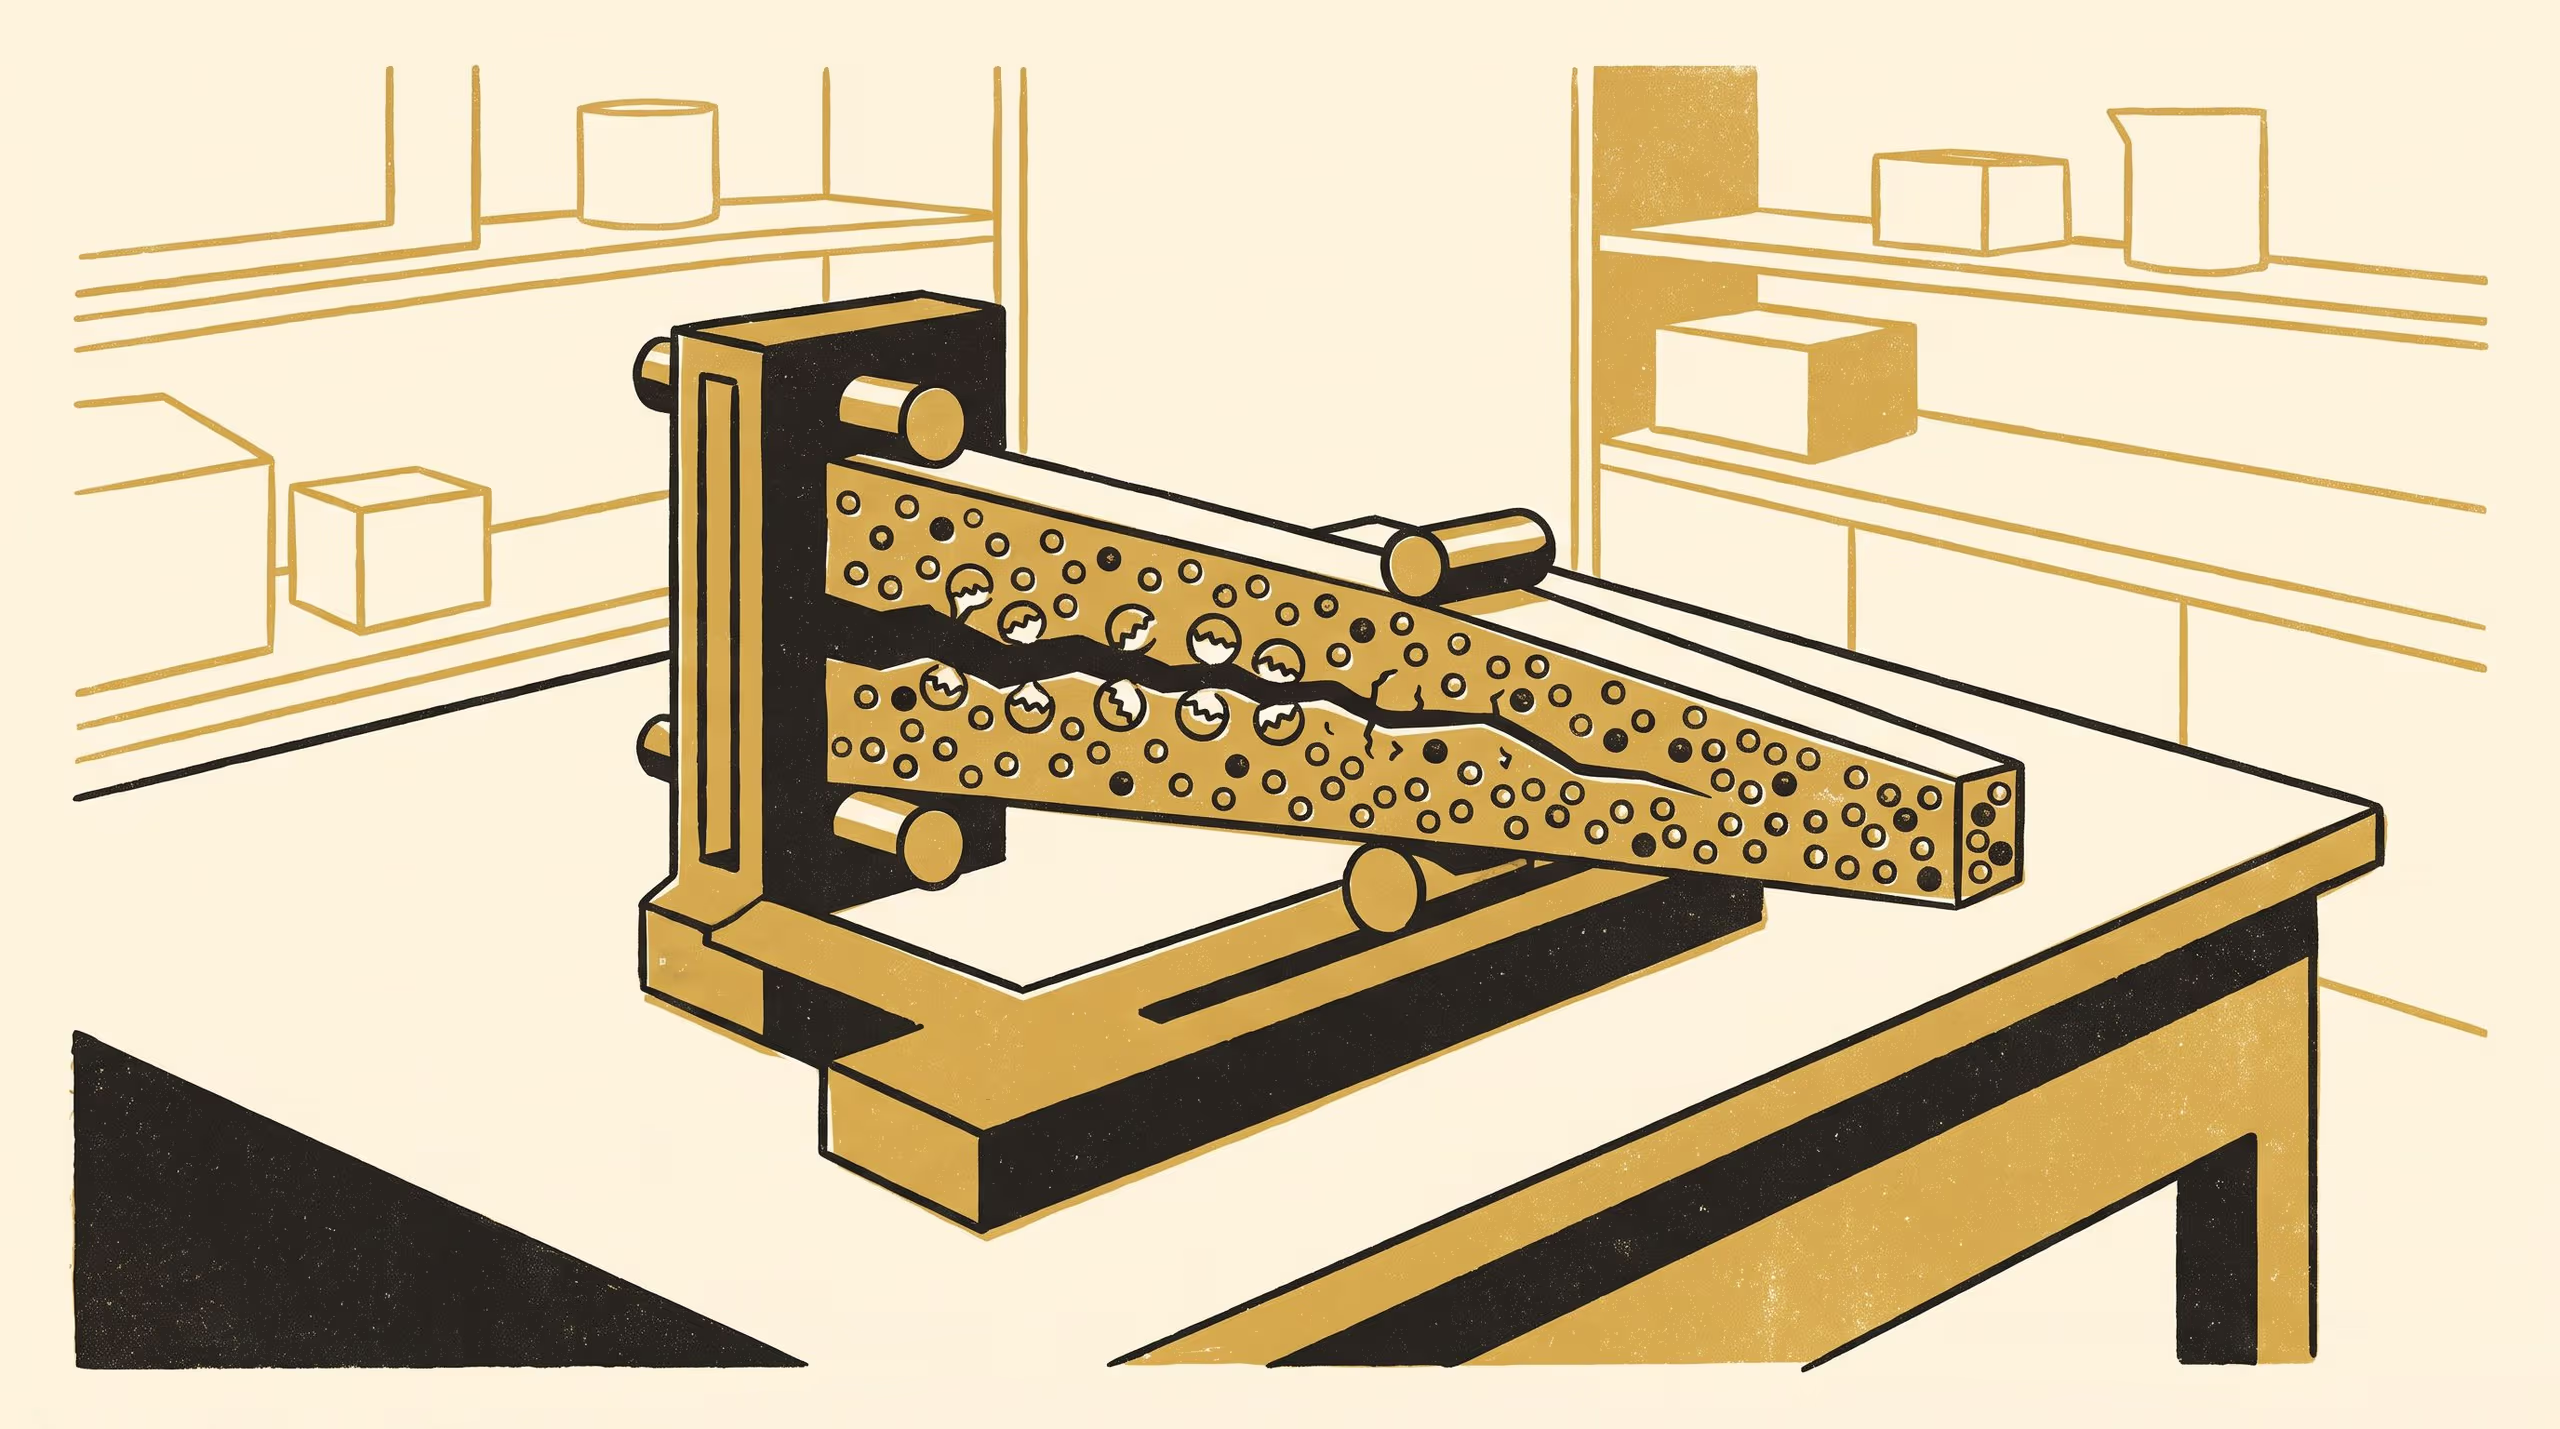
A Slop University paper measures two distinct ways a self-healing epoxy can let its owner down, and shows that one batch can manage both.
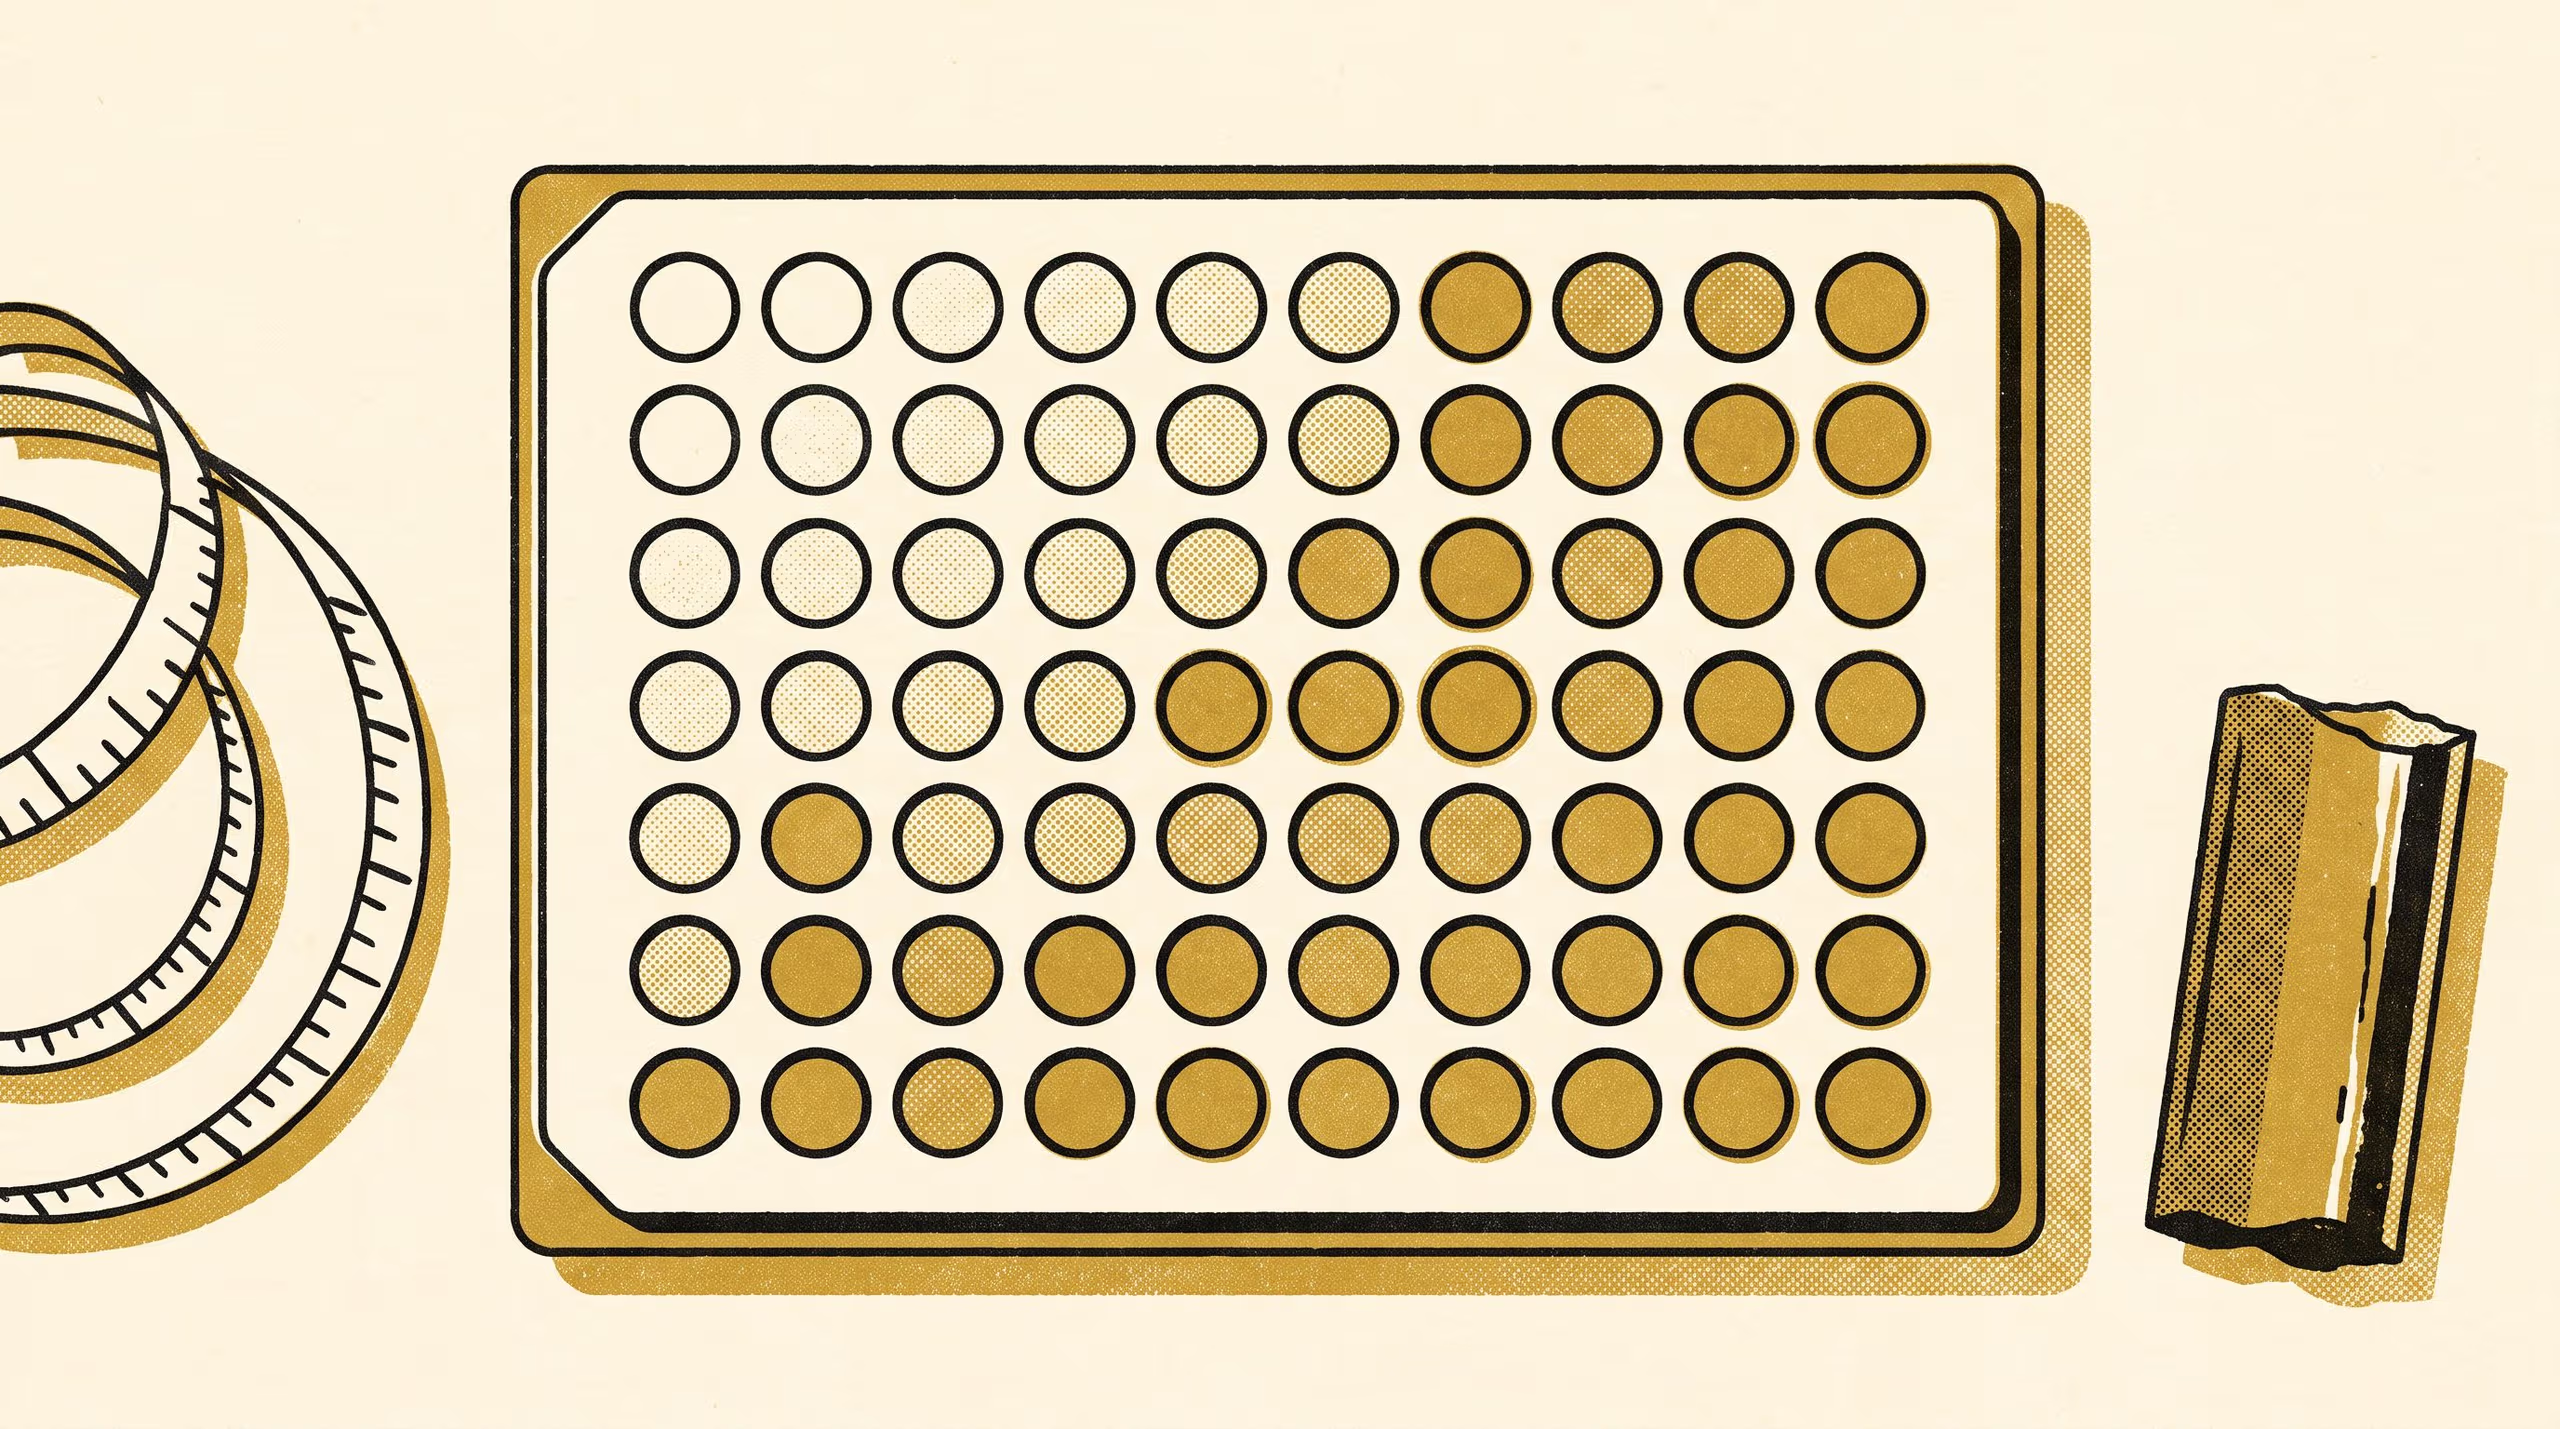
A research poster from the School of Underlying Conditions locates the chain length at which a family of laboratory-made salts stops improving against bacteria cultured from fouled monitoring bores.
The School of Underlying Conditions has appointed Associate Professor Ragnhild Uzoma Lead of the Basement Relations Group, formalising the direction of its work on drill core, field contacts and thin section.
The School of Continuous Improvement's Impact Report 2021–2026 sets out what its visual analytics program learned by sitting beside the people who read its charts.