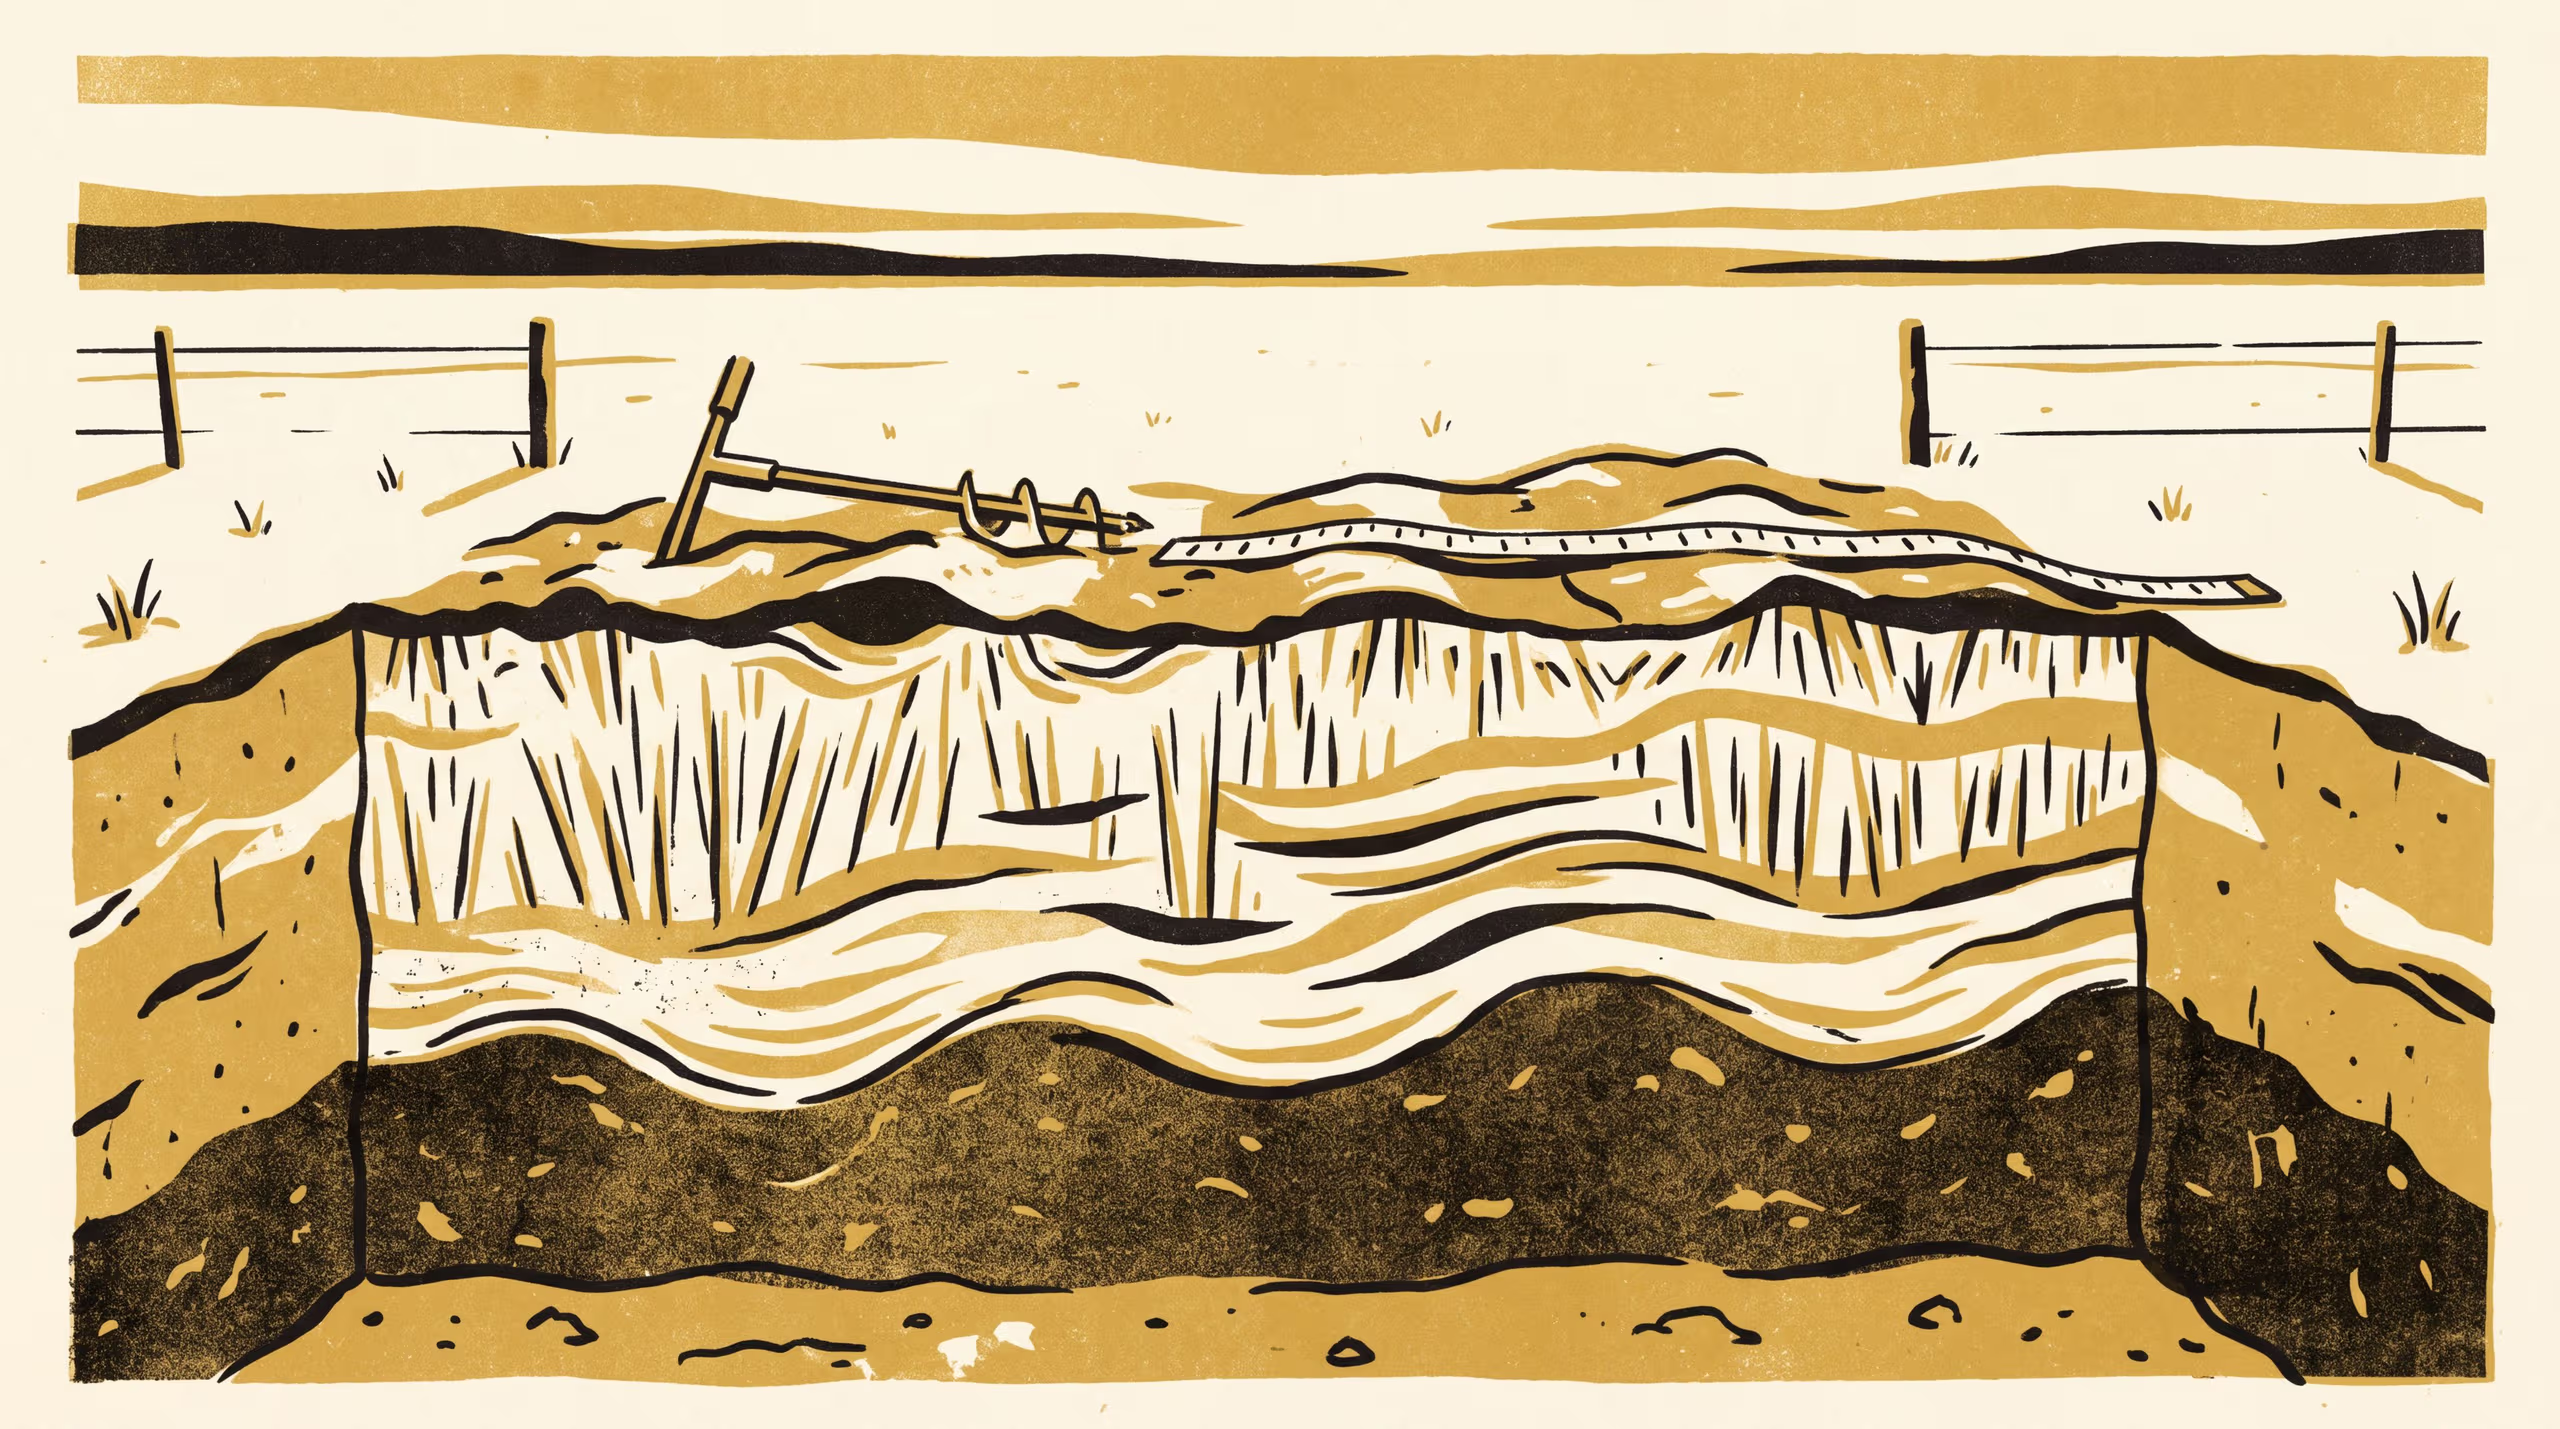
A new research poster from the School of Underlying Conditions asks whether the repeated freezing and thawing of a soil can be treated, for the boundary between two of its layers, as nothing more than a higher temperature.
A School of Underlying Conditions poster models a frost-heaved soil boundary as a warmed interface and finds where the comparison stops holding
How warm is a frost? For the line between two layers of soil, the answer turns out to be a number, at least up to a point. That is the proposal of How Hot Is a Frost?, a research poster by Dr Brynjar Obiora and Dr Bram Ntuli, which brings the statistical physics of interfaces to a question soil surveyors meet each winter in the pit face.
A surveyor learns to read a boundary with a trowel. It has been a pleasure to learn to read one with a thermometer as well, and we suspect the next few winters will tell us what it is we have been measuring.
— Dr Brynjar Obiora, Senior Research Fellow, School of Underlying Conditions
The poster builds a simulated soil out of two kinds of grain and puts it through a long run of freezing and thawing, then asks the boundary between them to account for itself in two separate ways. Where a light frost is concerned, both accounts agree on a single temperature. Past a certain strength of heave they part company, and the poster positions that parting as an invitation to understand what a hard frost does that warmth alone does not.
The work represents a meeting of field practice and theoretical method that the School has been cultivating across several recent outputs, and it carries the University’s conviction that the oldest working knowledge of a discipline can sit comfortably beside its newest mathematics. Dr Ntuli said the collaboration had “given a long simulation a very muddy set of boots”.
The full poster is available from the University’s research repository under an open licence, doi:10.5555/slop.ltnqpe.