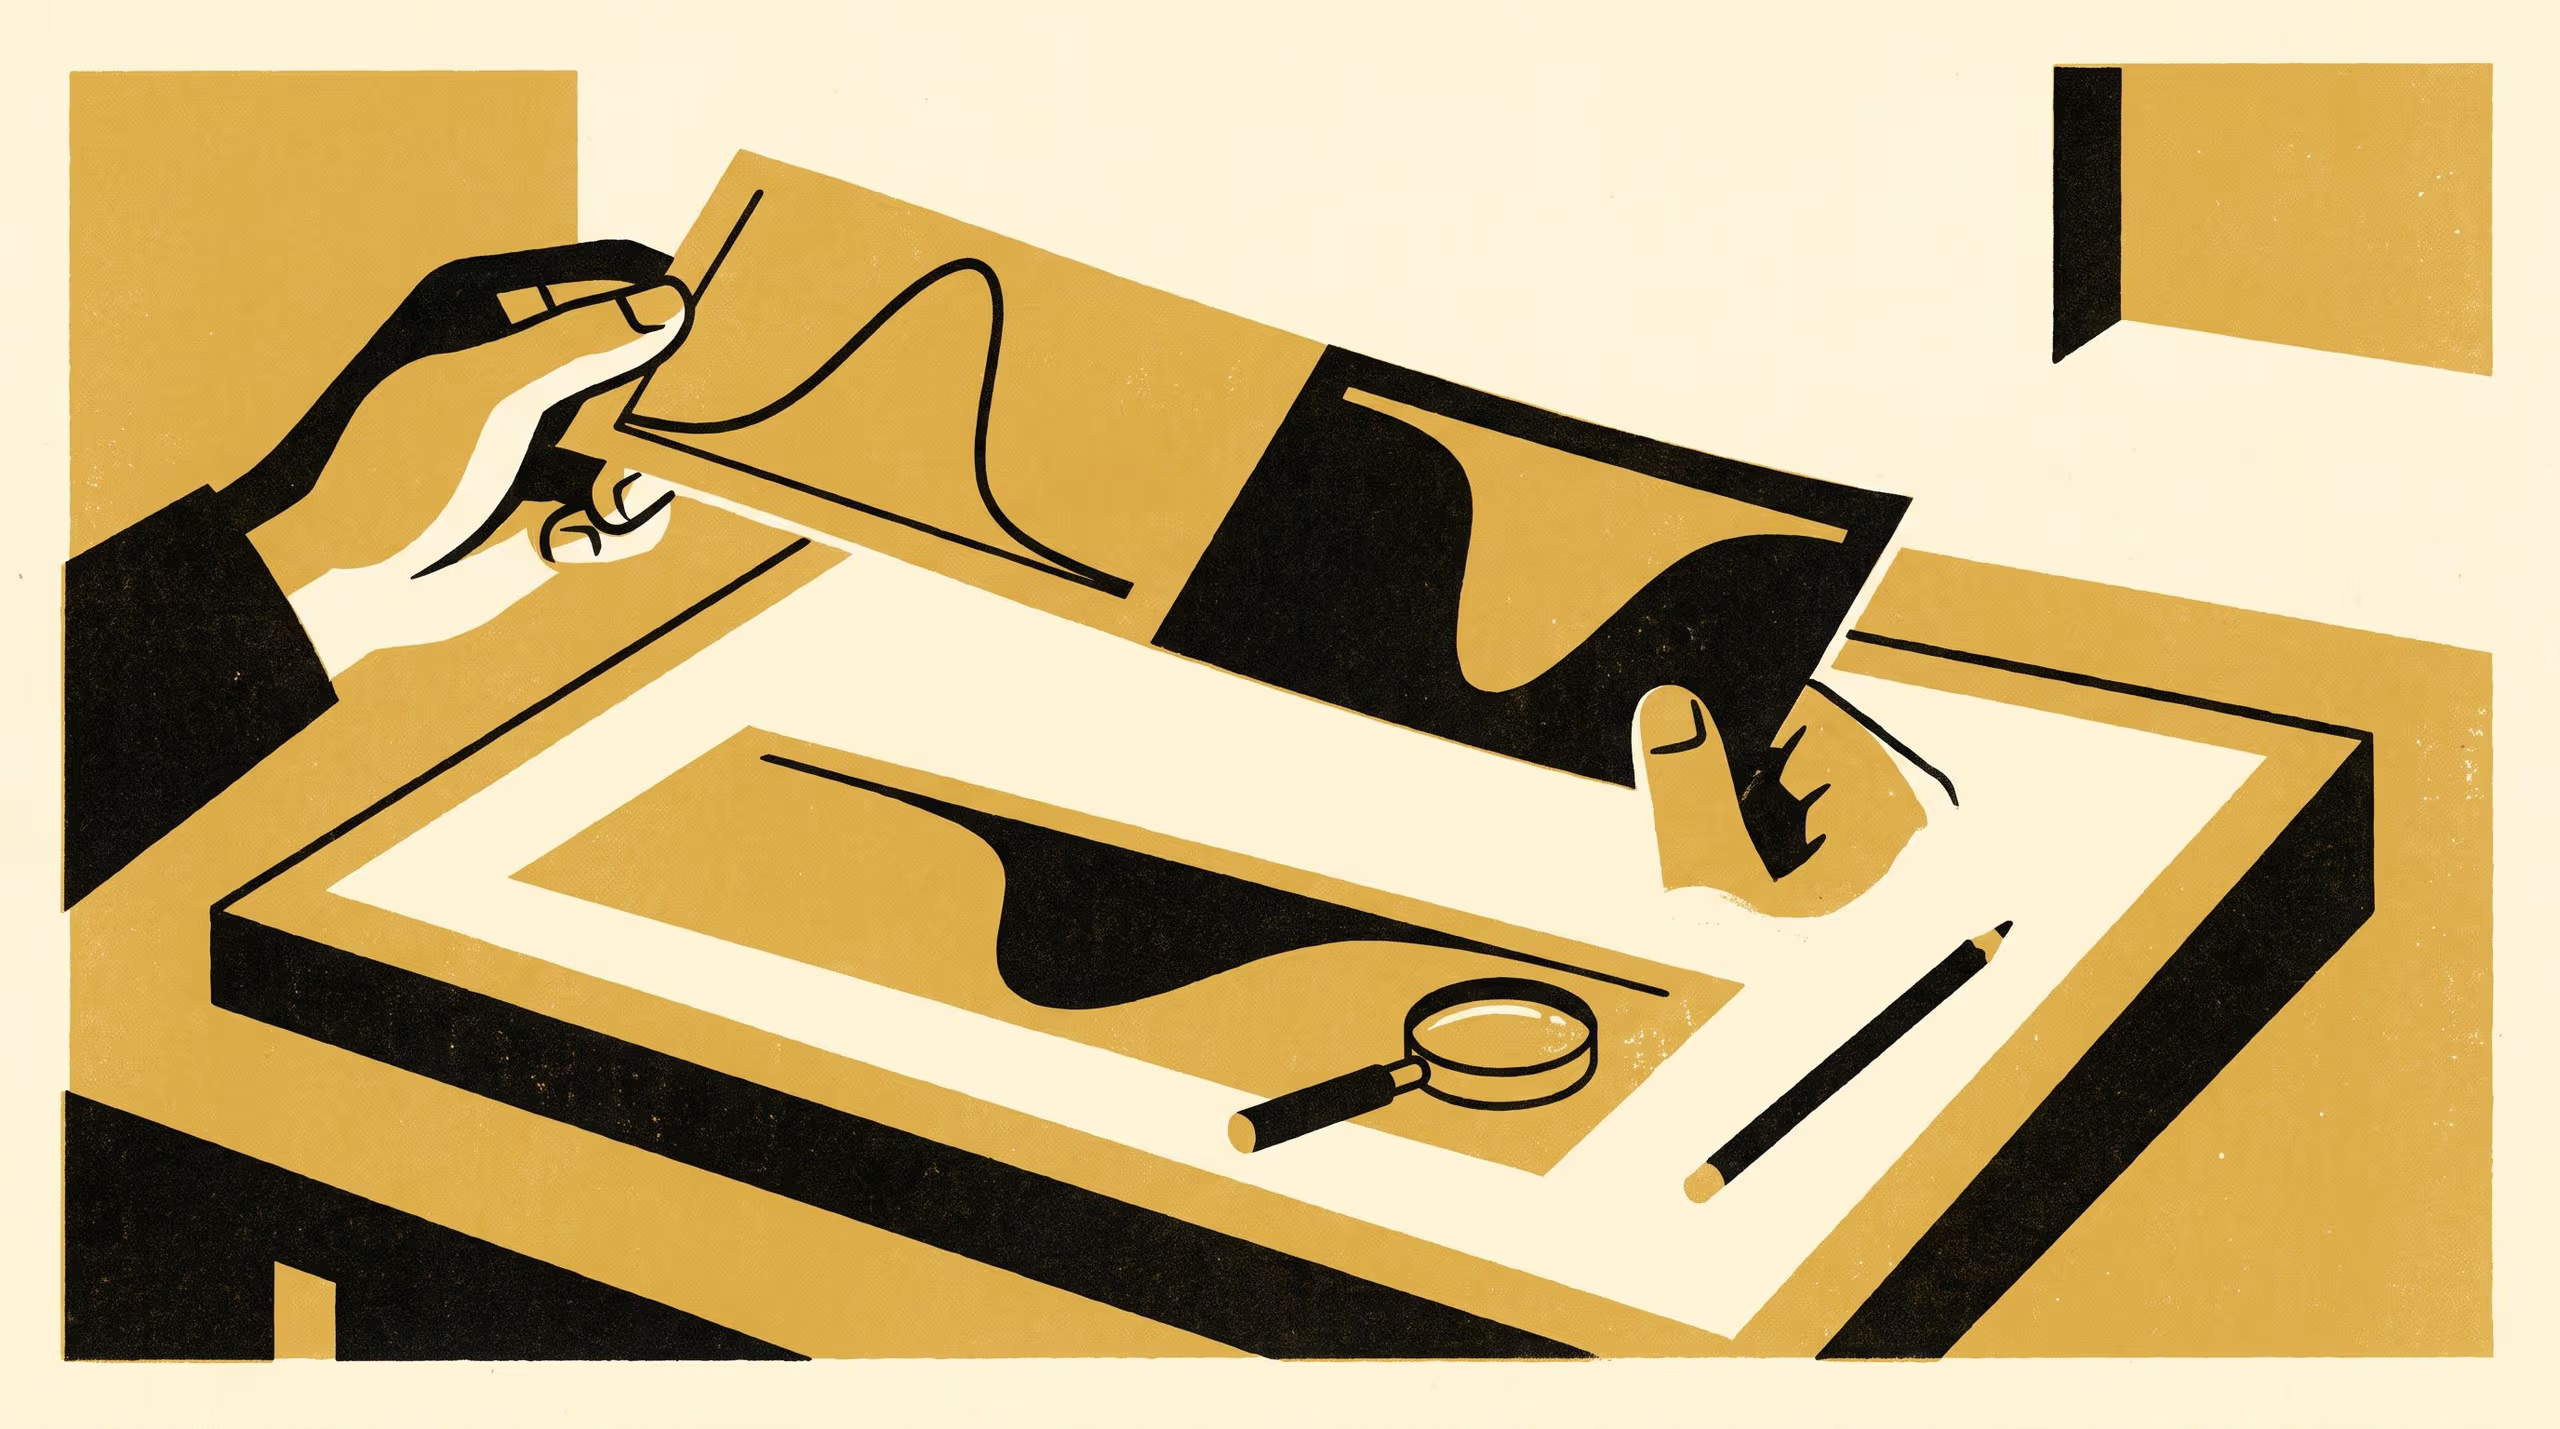
How forty years of one soil laboratory's thermograms told the reader the direction of an exotherm
A research poster from the School of Underlying Conditions codes 1,264 differential thermal analysis and calorimetry curves kept by one soil and clay laboratory between 1981 and 2020 for how each tells its reader the direction of an exotherm. It finds the instruction moving from the operator's hand-drawn arrow to the software's printed axis and then off the page: 54 per cent of the latest curves carry no signal, and 31 of 212 curves later reproduced in another document appear inverted.
| Authors | Vigdis Emenike , Brynjar Obiora , Iben Chikere |
|---|---|
| School | School of Underlying Conditions |
| Output type | Research poster |
| Published | |
| DOI | 10.5555/slop.z7uqi9 |
| Pages | 1 |
| Cited by | 1 output |
| Version | 1.0 |
| Licence | CC BY 4.0 |
Cites
Cited by
Cite as
@misc{slop_z7uqi9,
  author       = {Vigdis Emenike and Brynjar Obiora and Iben Chikere},
  title        = {Which Way Is Up?: How forty years of one soil laboratory's thermograms told the reader the direction of an exotherm},
  year         = {2026},
  publisher    = {Slop University},
  doi          = {10.5555/slop.z7uqi9},
  url          = {https://slop.university/outputs/slop-poster-which-way-is-z7uqi9/},
  version      = {1.0},
  note         = {Research poster},
}