The School of Continuous Improvement's newest display campaign recruits for the Master of Applied Measurement by asking students to look through a number to the work that produced it.
A landscape signage panel invites prospective Master of Applied Measurement students to read a chart back to the people behind its bars
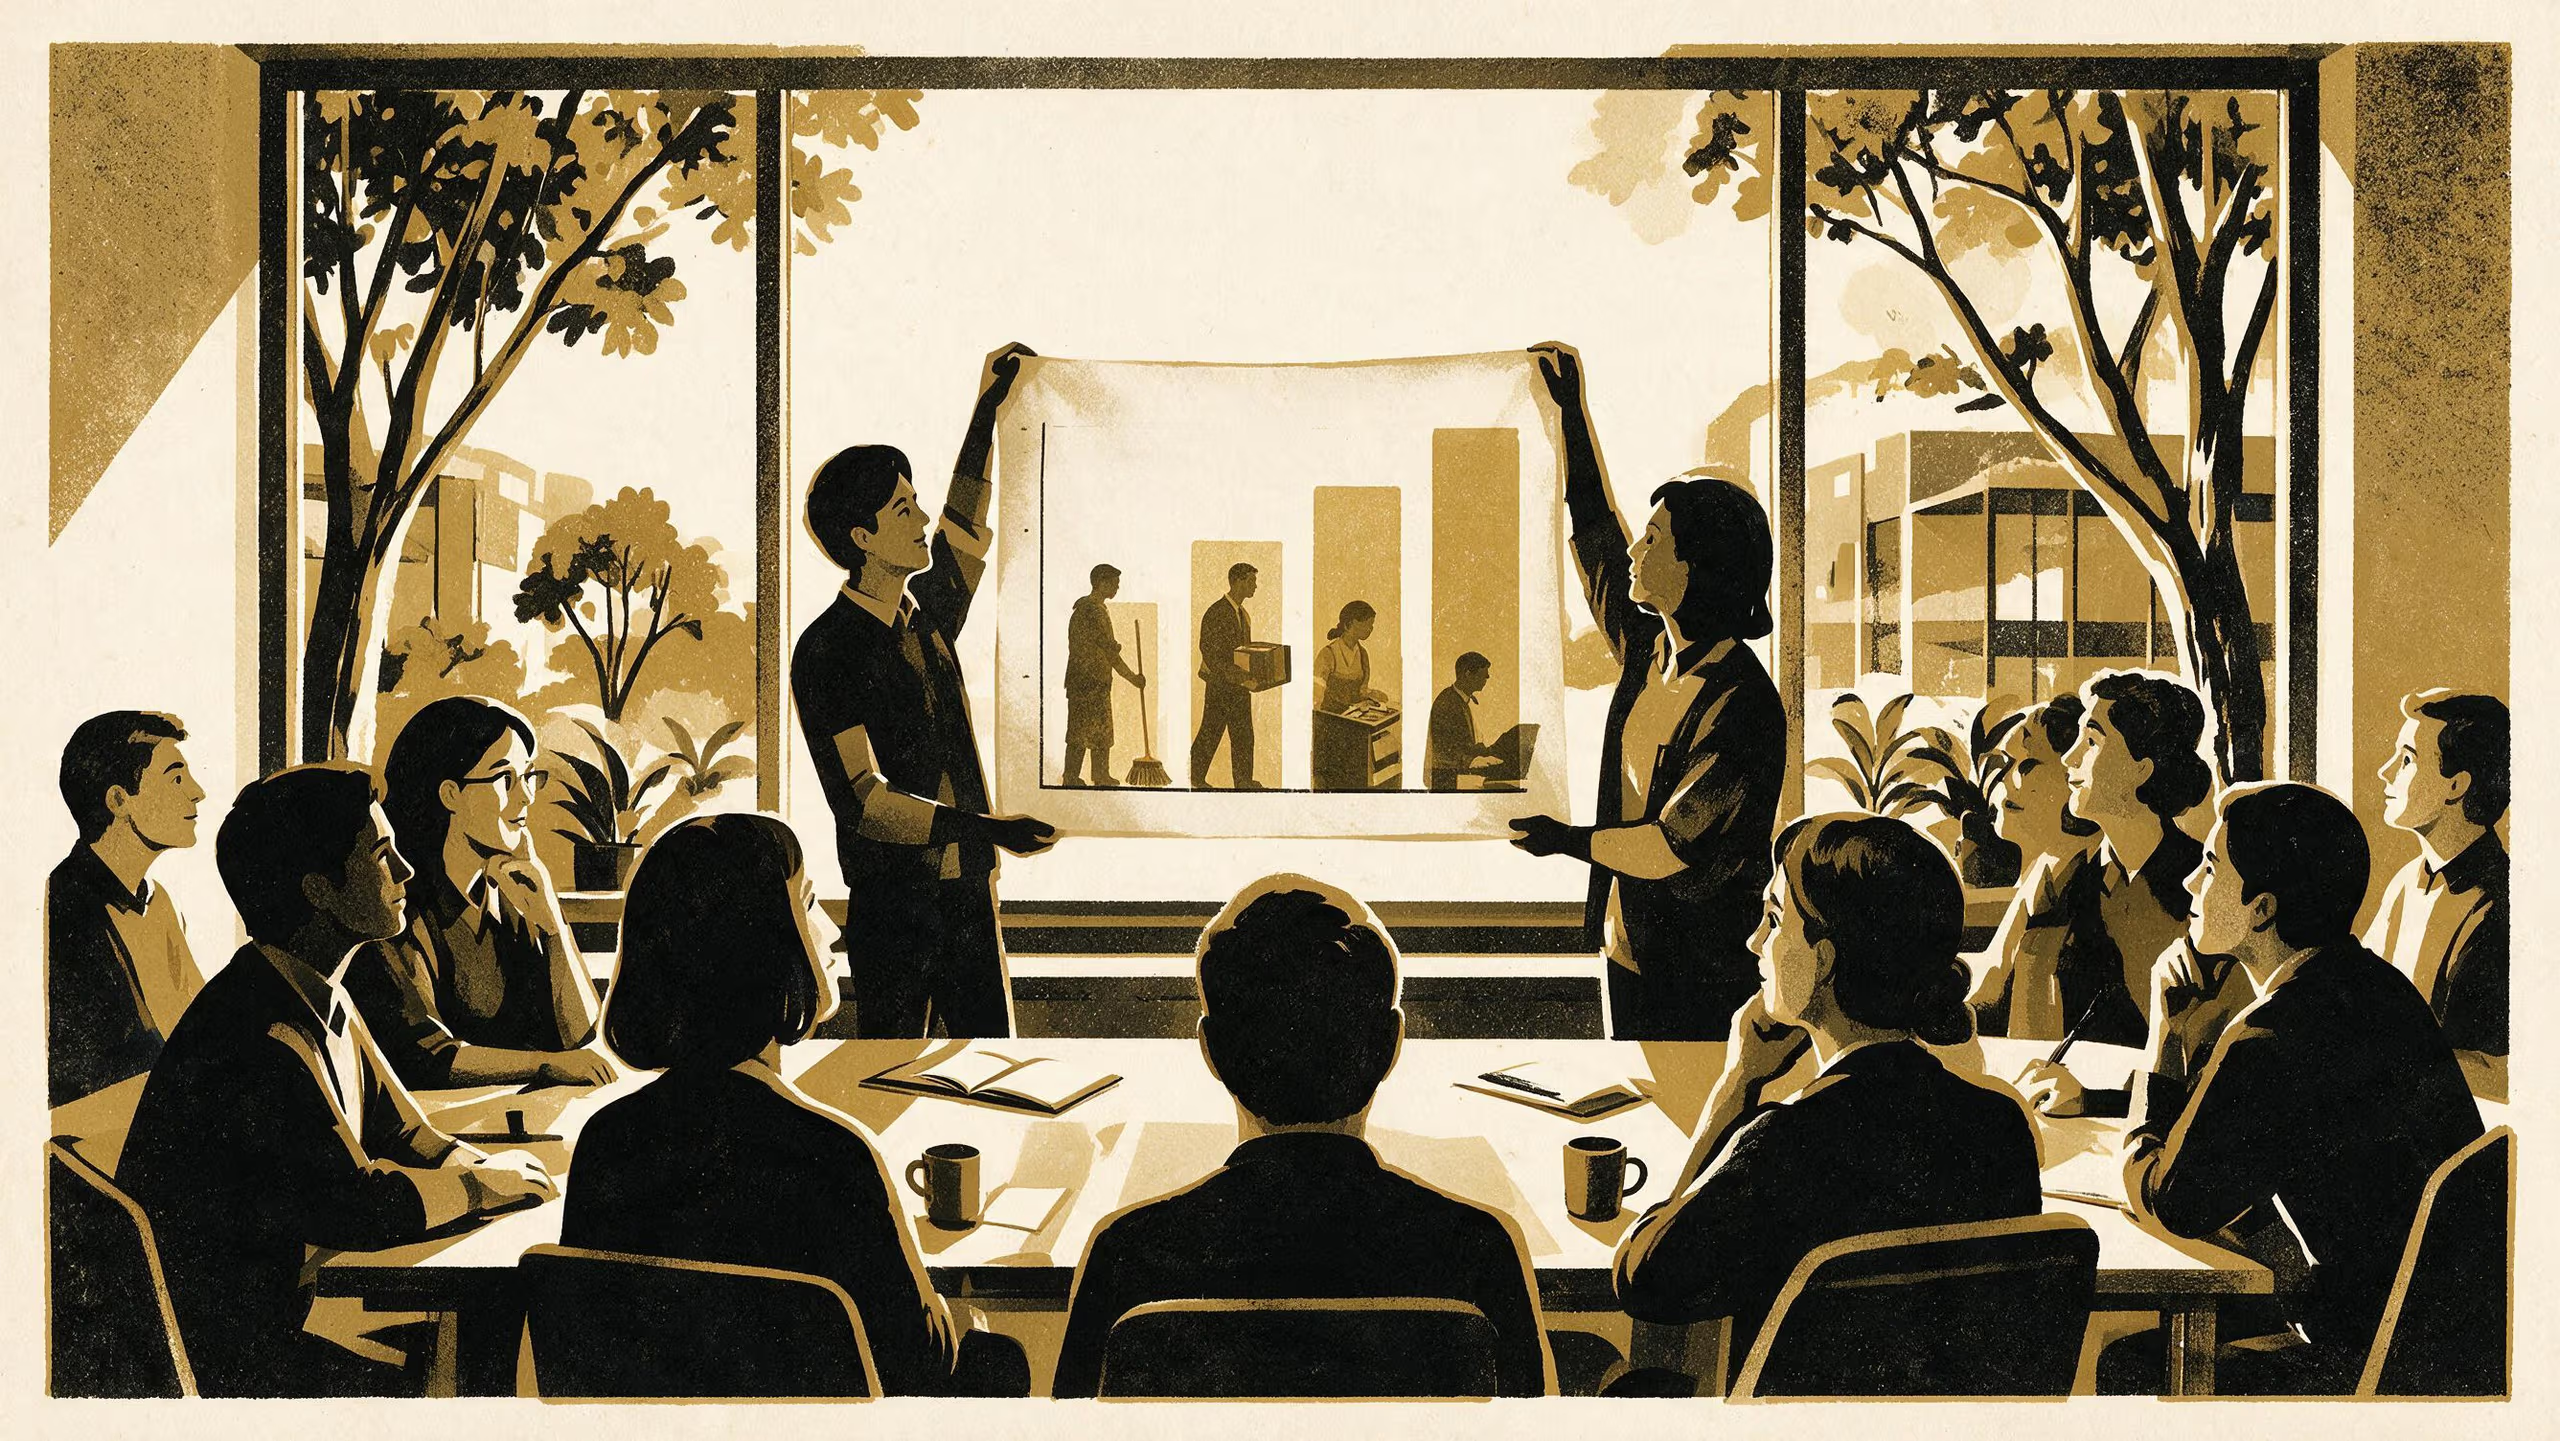
A bar chart, held up to the light, is the image the School of Continuous Improvement has chosen to carry its newest intake campaign for the Master of Applied Measurement. Learn to See the Labour Inside Every Number shows a seminar room in which two students stretch a printed chart across a window, so that each bar turns translucent and the figures of a cleaner, a courier, a checkout operator and a clerk appear inside it.
I spent years beside a status board that everyone looked at and nobody had been asked to keep. The program is where students start asking who keeps the board, and I find that question gets better company every year.
— Dr Marit Osayande, Lecturer and Convenor, Living Dashboard
Developed under Dr Osayande’s direction, the panel situates the School’s measurement curriculum within a longer critical tradition concerned with how value appears to belong to the figure rather than to the effort that produced it. It frames that tradition as a practical literacy, one that equips graduates to move fluently between an indicator and the operational realities sitting beneath it. Its small print directs readers to three of the School’s posters: on a council’s community-grants count, on supervisors’ self-assessments set against a retail chain’s own logs, and on a traffic controller stood down once the bat reaches its bucket.
For the School, the campaign signals a maturing confidence in what an applied measurement degree can offer, and a willingness to put the people behind the numbers at the front of the window.
The full panel is available from the University’s research repository under an open licence, doi:10.5555/slop.xublhq.