A new Slop University research poster reconstructs true boarding counts from smartcard tap timestamps across six stations, and finds the published crowding index undercounting riders who vault the gate or forget to tap off.
A seventeen-week reconstruction of smartcard boardings finds a published crowding index missing the riders who never tapped
A transit agency’s crowding index is built entirely from taps: a card against a reader, a green light, a count added to a station’s tally. Slop University researchers spent seventeen weeks checking what the taps leave out.
A number that decides how often a train comes deserves the same scrutiny as the train itself. That is what the Indicator Commons is for.
— Dr Renke Sabel, Senior Lecturer and Convenor, Indicator Commons
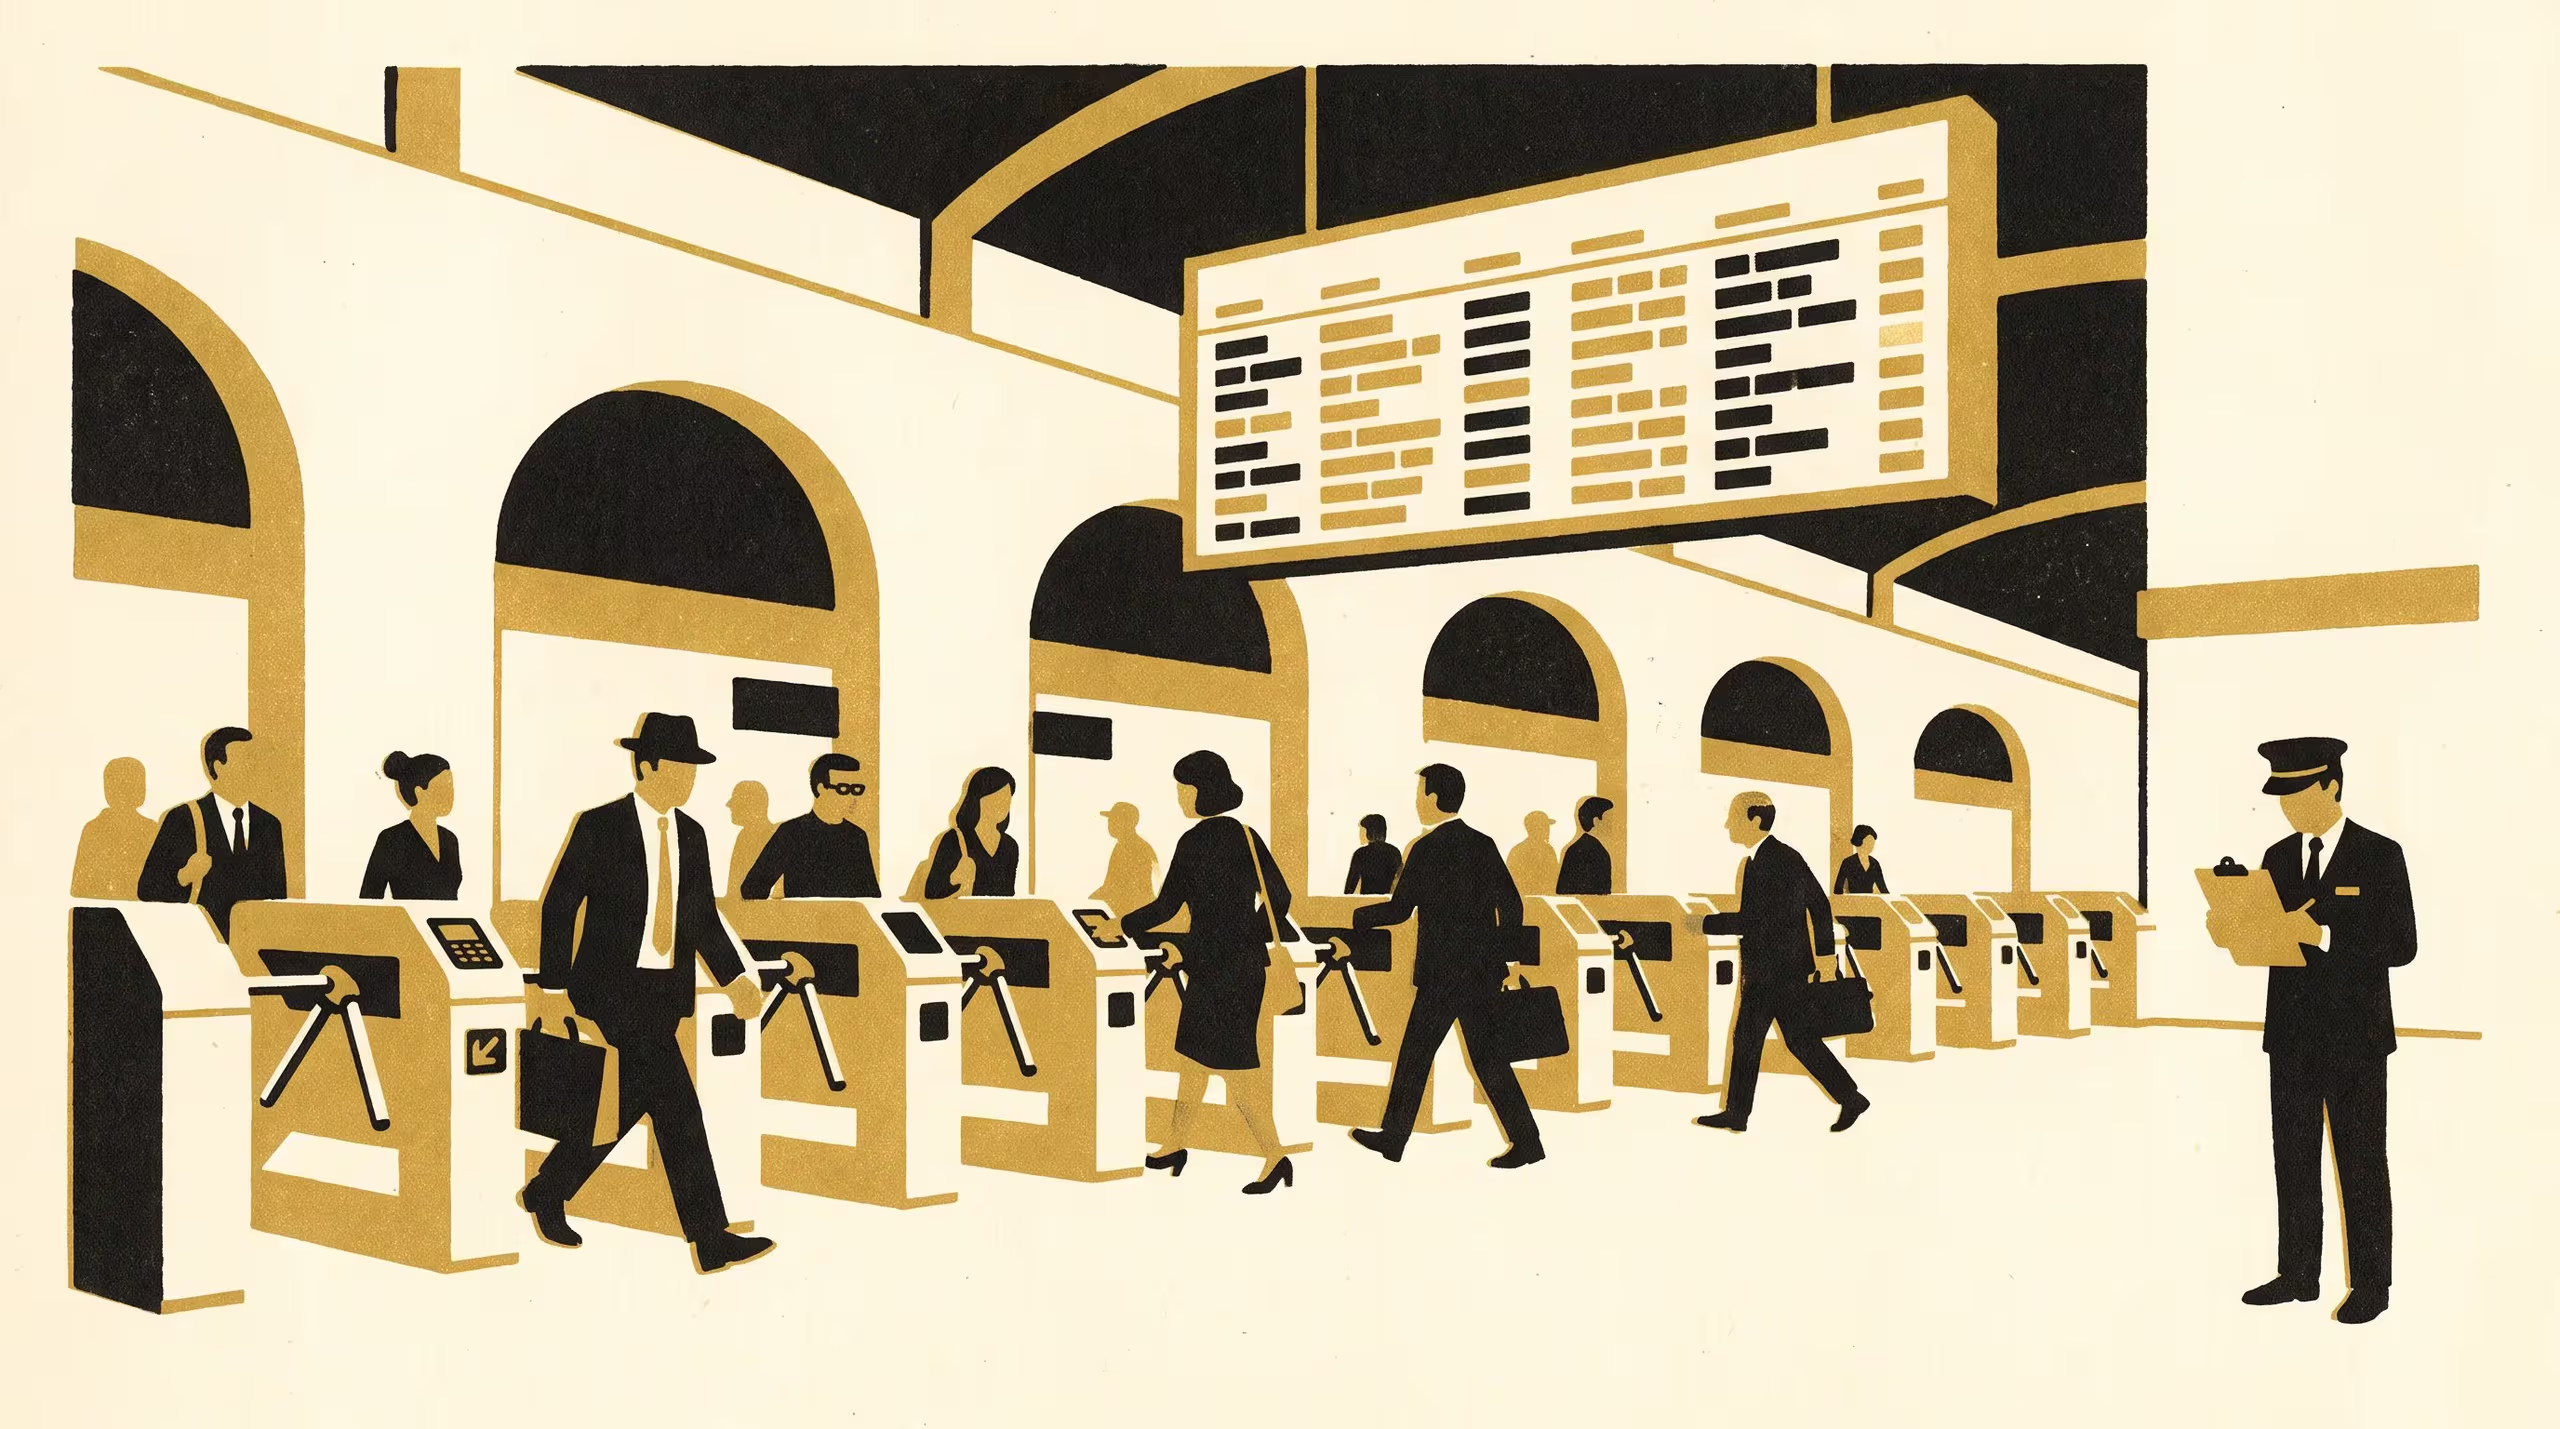
The Gate Remembers What It Wants To, deposited today through the Office of Research Outputs, reconstructs true per-service boarding counts from raw tap and turnstile logs across six stations and forty-two weekday services, cross-checking the result against station camera headcounts on nine audit days. The reconstructed counts run higher than the published index at five of the six stations, enough in one case to move a station across the threshold the agency uses to schedule extra services.
“The crowding index was exactly the kind of number the Living Dashboard’s founding brief warned about,” said Dr Marit Osayande, Lecturer and Convenor, Living Dashboard. “The number that gets trusted precisely because nobody has had to look at where it came from.”
The School of Continuous Improvement welcomed the release as further evidence of the quiet correction its Indicator Commons exists to produce.
The full poster is available from the University’s research repository under an open licence, doi:10.5555/slop.fwqb8f.