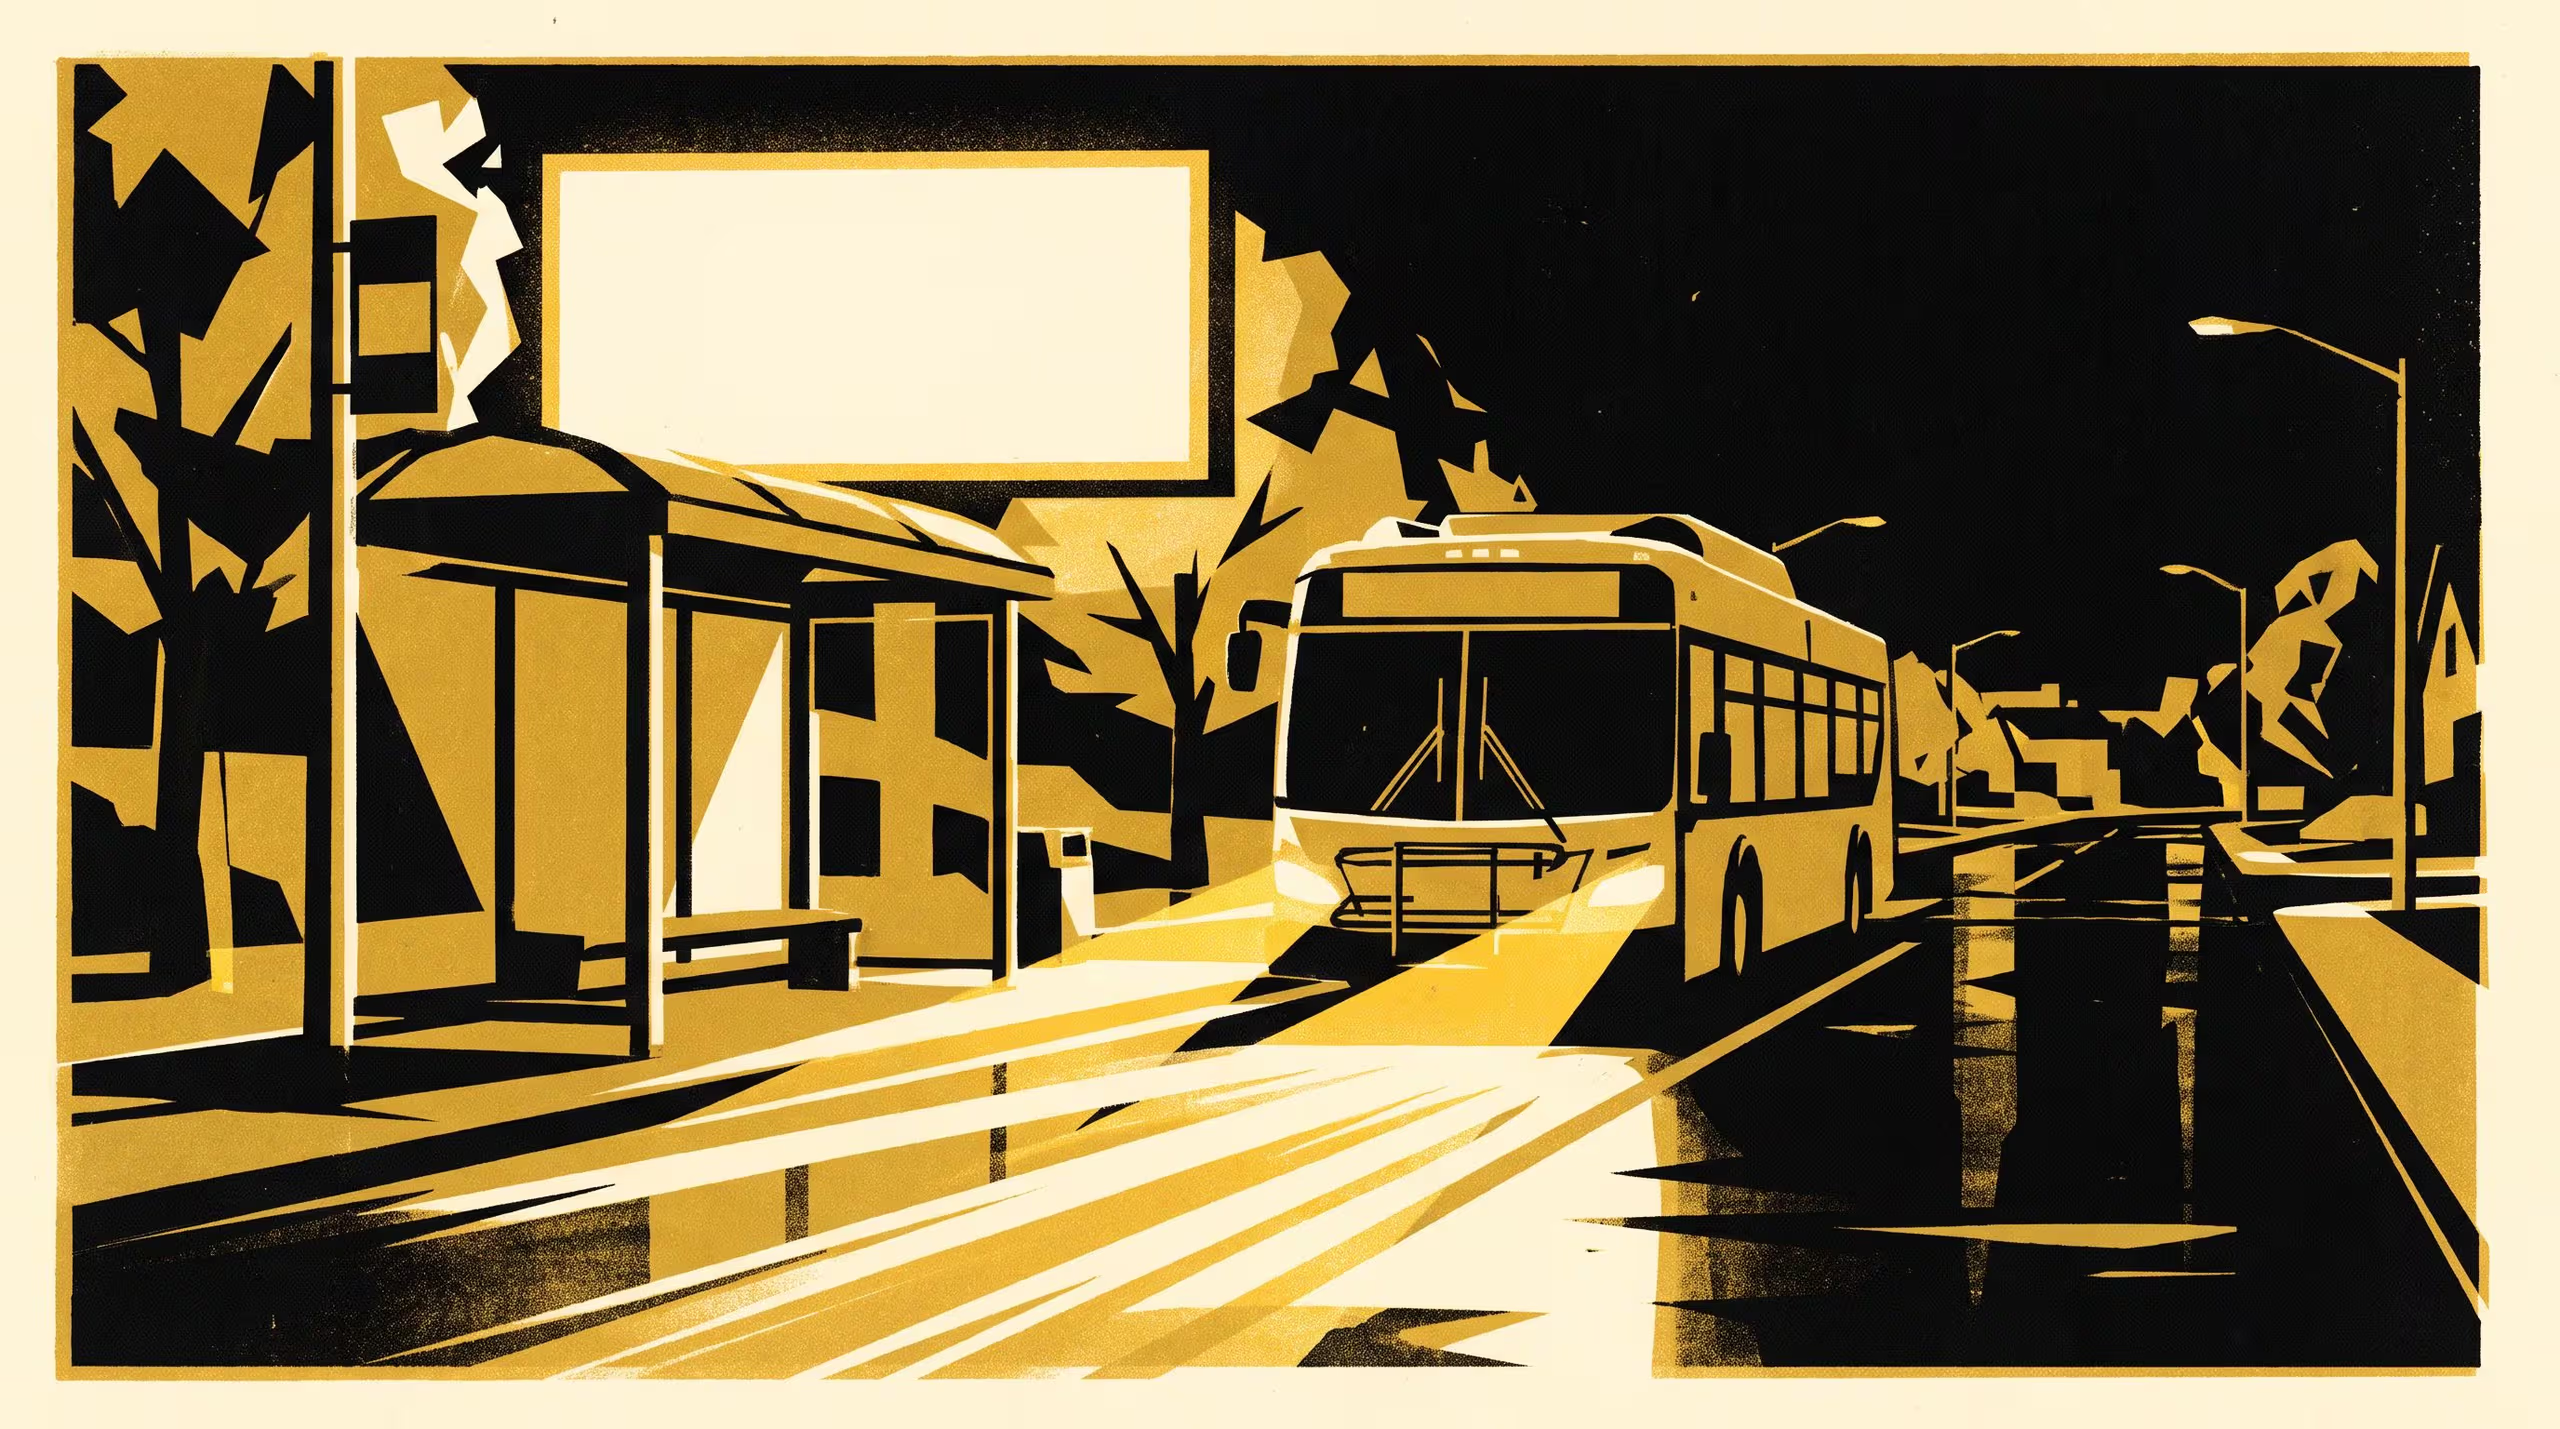
A new research poster from the School of Continuous Improvement matches a suburban bus stop's live countdown against the bus's own GPS trace over 15 weeks, finding the display looks identical whether its source data is arriving or not.
A 15-week field validation finds a suburban bus stop's countdown just as confident whether or not the bus's GPS feed is still arriving
A countdown sign at a suburban bus stop promises a number tied to where the bus actually is. A new research poster from the School of Continuous Improvement finds the sign keeps that promise for as long as the bus’s GPS feed is arriving, and quietly keeps making it once the feed goes quiet too.
Over a 15-week deployment at a single suburban stop, Dr Osei Vandermeer and Dr Mirela Hanke matched the sign’s displayed countdown against the operator’s own GPS trace for 48 arrivals, including 19 spans where that trace dropped out entirely. Agreement between the sign and the bus held closely while the feed was live and collapsed once it lapsed, with the display’s font, icon, and update cadence carrying across both states without variation.
A sign that looks equally sure of itself in both states isn’t reporting a position. It’s reporting a format.
— Dr Osei Vandermeer, Research Fellow and Convenor, Review Cadence Observatory, School of Continuous Improvement
The finding lands squarely inside the School’s wider case that an instrument’s confidence and its accuracy are separable, and separately worth checking. “A rider has no instrument of their own to tell a tracked minute from a scheduled one,” said Dr Mirela Hanke, Postdoctoral Fellow. “The display was never built to admit the difference, so it doesn’t.”
The team’s next deployment will instrument a second, busier route to test whether dropout frequency scales with how many vehicles are competing for the same signal.
The full poster is available from the University’s research repository under an open licence, doi:10.5555/slop.ipputw.